
Tag Archives for " report "

Everything You Should Know to Create a Useful Competitor Report
Analyzing and monitoring your competition is fundamental to any business’s success.
So what should a good competitive report include and how to take it from research to action?

Why Does My Business Need a Competitive Report?
There are many reasons why a business may need a competitive report, and all of these are valid:
- To better understand your target audience by researching how they find and engage with your more established competitor
- For market research: Understand what is currently available on the market and where your business fits inTo get an estimate of your future marketing budget
- To identify effective marketing tactics, etc.
Business owners that claim they don’t need a competitive report because they already know everything are clearly missing out. Competitive research is much more than copying your more successful competitor’s marketing tactics.
Actually, it is not at all about that because copying would never bring you ahead.
Competitive research is about understanding your target market and distinguishing your unique value proposition and consequently your unique marketing strategy to conquer it.
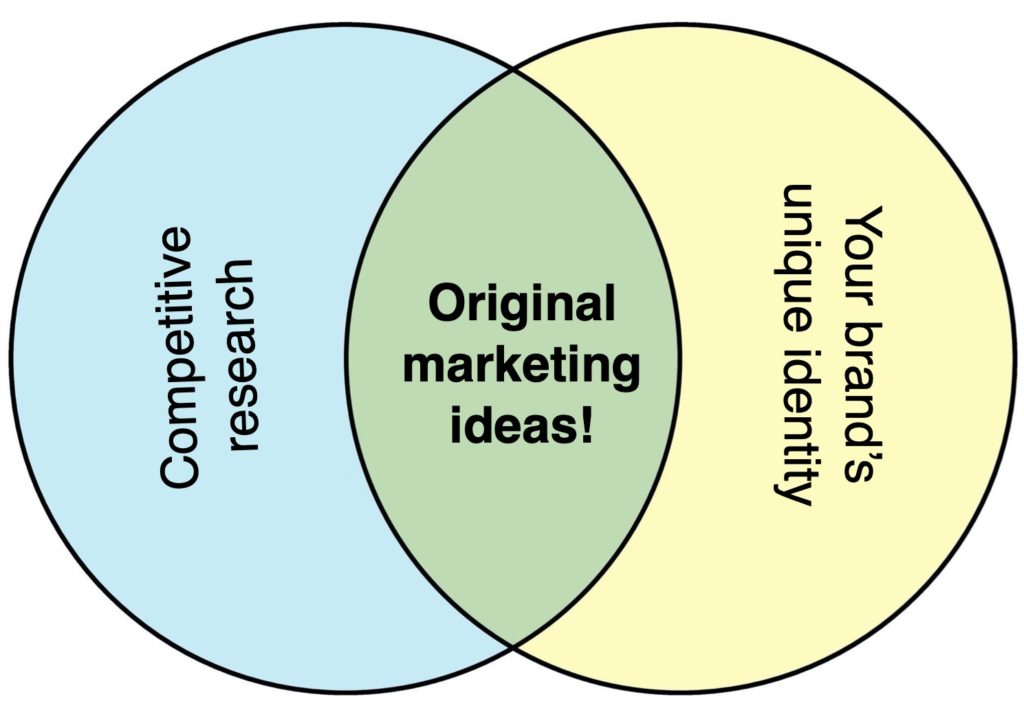
So what should a solid competitive report include?
Competitive Benchmarking
Competitive benchmarking means collecting the performance data of your competitors and comparing it to your business. It is used to measure and monitor your business’s performance against its competitors.
You can choose your own performance indicators to track and compare. These may include:
- Public traffic data (from tools like Ahrefs, Alexa, and Similar Web)
- Organic rankings
- Brand awareness and sentiment (based on brand mentions), etc.
This section in your report is going to always evolve but it is also fundamental because your whole competitive analysis will evolve based on KPIs you will identify as the most important for you.
Basic Overview of Competition
There are fundamental KPIs you are going to focus on and there are secondary metrics that will help you identify competitors to keep an eye on.
This section is about the latter. This basic section helps you look at your competitors’ secondary metrics at a glance to identify if there’s a definitive pattern to look deeper into:
- Backlinks
- Organic traffic
- Social media followers
- Social media engagement, etc.
- Tools like Ahrefs, Keyhole, and Similarweb will help you collect all the necessary data.
Detailed Dive into Organic Search Engine Optimization Tactics
Look at some key search engine optimization tactics your competitors are using:
- Which keywords are they focusing on?
- How are they optimizing their title tags and meta descriptions?
- Are they optimizing their old content and how often?
- What does their site architecture look like?
- How are they organizing their main navigation?
- What’s their internal linking strategy?
- What are their most successful pages (i.e. those that rank for the most competitive search queries)?
- What’s their semantic optimization strategy?
Try running a few of the most important pages through a tool called Text Optimizer to determine whether your competitors are doing a good job optimizing for search intent:
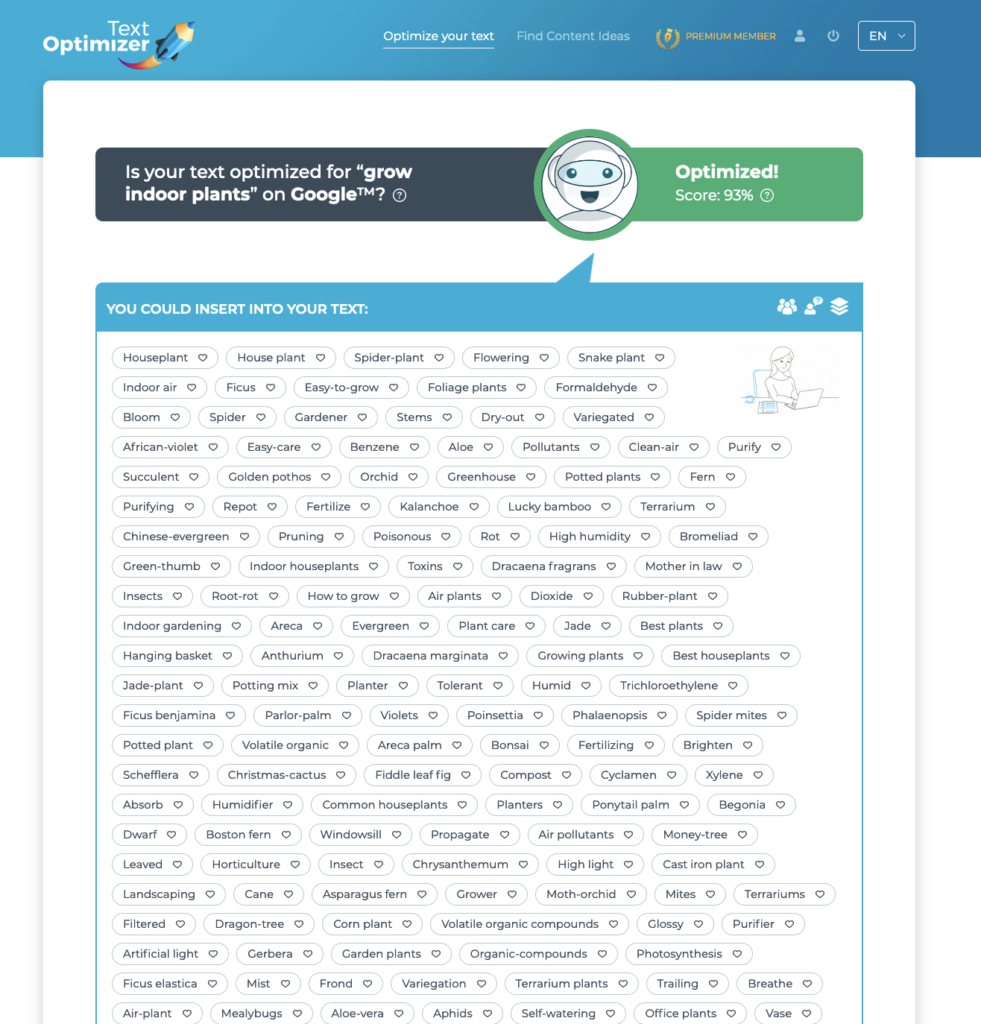
One of the most actionable steps here is to look at Content Gaps, i.e. researching which keywords your competitors are ranking but your site is not. This is a great way to expand your content strategy to include new keywords. Ahrefs provides this analysis, so it is both easy and effective:
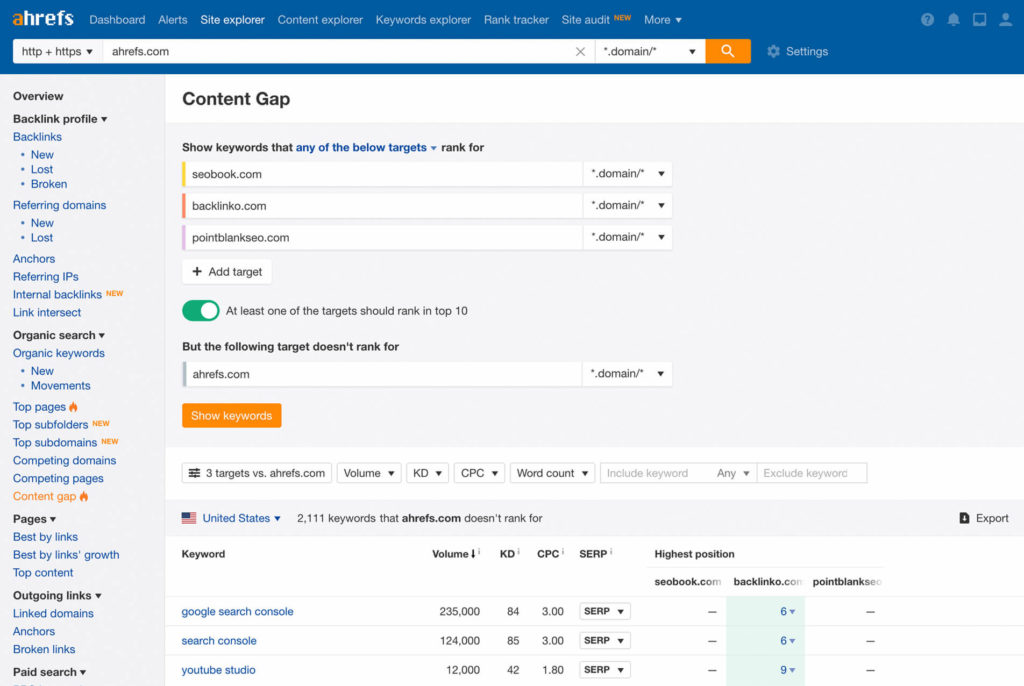
Competitors’ Backlink Research
Backlink research is important for many reasons but doesn’t just use it in an effort to “steal” some of those tactics or claim some of those links. Look at a bigger picture:
- Who are your competitors’ promoters (i.e. people who link to them) and how did your competitors win their hearts?
- Which PR tactics seemed to work best for your competitors and why?
- How are they utilizing content to generate backlinks?
The purpose of competitive backlink research is to understand what works for niche publishers and how you can build your own long-term relationships with them to outmatch your competitors in the long run.
There are quite a few backlink checking tools that would help you create this report.
Social Media Growth and Engagement
The first part of this section is, again, an overview giving you an idea on who to research further. Create a quick chart summarizing your competitors’ active social media channels, number of followers and friends, and their overall activity.
Keyhole can help you with that section:
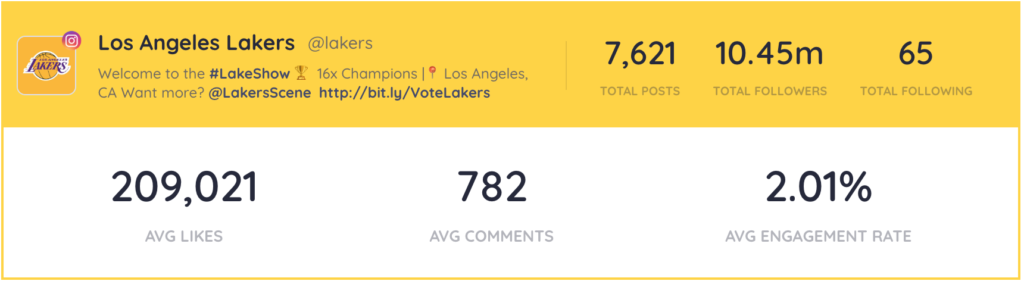
Social Media Tactics to Take a Note of
Here I suggest highlighting some creative tactics your competitors are using on social media. Forget about numbers: Highlight what you found ingenious even if that didn’t yield obvious great results. Make lots of screenshots!
- Did your competitor use humor when replying to a customer?
- Did you like the video they uploaded for a holiday?
- Was their sponsored update particularly creative and attention-grabbing?
- Did they manage to get attention from a niche influencer?
- Did you like the idea behind their social media contest or poll?
This section is supposed to inspire your social media team. Discourage them from copying anything your competitor did on social media (this could quickly turn into a reputation crisis). Instead, let this section be a conversation starter for your team to come up with their own ideas.
Conclusion
There are very few business ideas or models that have no competition. If you have found one: Good for you! For the rest of us, a competitive report is a key to marketing success, especially if you make it actionable and use it as a starting point for your own brainstorming meetings.
Distinguish tactics to discuss and use unified communications to come up with the ideas to improve and expand those tactics, as well as find unique angles and maintain your brand identity. Good luck!

The post Everything You Should Know to Create a Useful Competitor Report appeared first on DigitalMarketer.
Source: digitalmarketer.com

Using the Google Search Trends 2021 Report to Generate Content Ideas
As marketers, we’re constantly attuned to Google’s ever-changing algorithm, keeping an eye toward shifts in prioritization and SERPs.
Google is pretty good at equipping users (and businesses) with information about what it considers important by providing resources like their search engine optimization (SEO) guides and the annual Search Trends report.

The Google Search Trends report can be an incredible asset that allows you to dig into users’ search habits and gain access to a steady stream of content ideas.
In this blog, we’ll unpack how to mine the Google Search Trends report for content gold to flesh out your content calendar into 2022 and beyond.

What Is the Google Search Trends Report?
Published each year, the Google Search Trends report aggregates the highest-ranking terms for the year.
Curious readers—or those of us looking for content ideas—can visit the mini-site to explore search volume through several lenses.
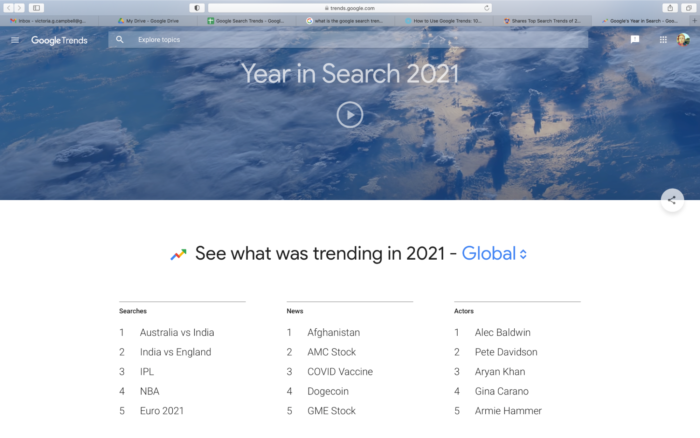
You can break it down by region and then a topic, including categories like actors, TV shows, sports teams, songs, and many more.
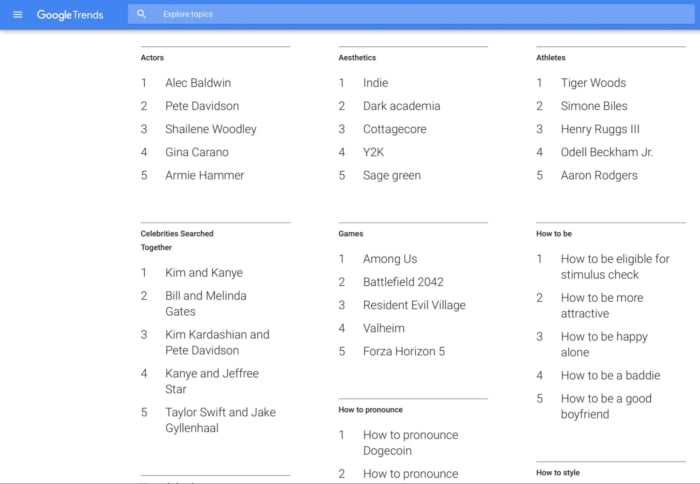
While this report can certainly generate year-end nostalgia, it also offers a unique perspective into the terms that gained the most search volume and traction in the last year.
For marketers, that data can be gold.
Top Trends from the 2021 Google Search Trends Report
Regardless of what region you’re researching, you’ll find a common theme in this year’s report: perseverance.
2021 saw searchers looking for “how to heal” and “how to be hopeful.” This theme resonated in more concrete searches as well with high volume searches including, “how to start a business in 2021” and “how to get a job in 2021.”
Entertainment was another balm in a complicated year. We looked to Google for distraction and clarification, typing in searches like “Squid Game” and “Amanda Gorman.”

Here are a few other Google Search Trends that got a lot of attention around the globe this year:
- Australia vs India
- India vs England
- IPL
- NBA
- Euro 2021
- Copa América
- India vs New Zealand
- T20 World Cup
- Squid Game
- DMX
In the United States, here’s what users were most interested in overall:
- NBA
- DMX
- Gabby Petito
- Kyle Rittenhouse
- Brian Laundrie
- Mega Millions
- AMC Stock
- Stimulus Check
- Georgia Senate Race
- Squid Game
While these searches can entertain, they can also inform your content strategy, by helping you create content that users are likely to be interested in.
How to Use the Search Trends Report to Generate Content Ideas
Struggling to come up with fresh, new content ideas? I’m no stranger to the frustration that comes with this.
Using Google Search Trends, you can determine what topics users are interested in, increasing engagement while building relationships and goodwill.
Below, I’ll break down the five best strategies for harnessing the insights associated with the search trends report to generate content ideas.
1. Use Popular Search Terms and Find a Unique Angle to Cover the Topic
While a blog post about the permanence of the cottage come aesthetic might be popular, this topic may not align with your brand. However, also topping the aesthetics search list is “sage green,” a topic that might be related to more industries.
Whether you’re a small boutique or a landscaping company, you can take advantage of this particularly high-volume query and build out a content plan to address it.
Sage green might not be in your wheelhouse.
If that’s the case, look for other search terms that might meet your audience’s interest in some way.

This part of the Search Trends reports breaks down searches by different topics, including:
- culture
- economy
- entertainment
- environment
- health and wellness
- news and events
- philanthropy
- representation sports
“How to maintain mental health” was searched more than ever in 2021—most industries could leverage that to provide mental health advice and tips to their audience. For example, I might write about how to maintain mental health as a remote digital marketer or how to help your remote team maintain their mental health.
By aligning your audience’s interest with a popular search query, you not only increase the visibility of your content, you also offer your existing and would-be audience a fresh perspective within your industry.
2. Search for Topics Using the Search Bar
Suppose you’re curious about the search visibility behind a certain query. In that case, you can use the Google Search Trends report to explore how much a specific term resonates, as well as related queries and terms.
For example, we searched “digital marketing.”
In addition to highlighting the term’s prominence, the report also offers tons of valuable detail. We could build a content strategy with a pretty solid idea of what type of content will and won’t resonate from this one search.
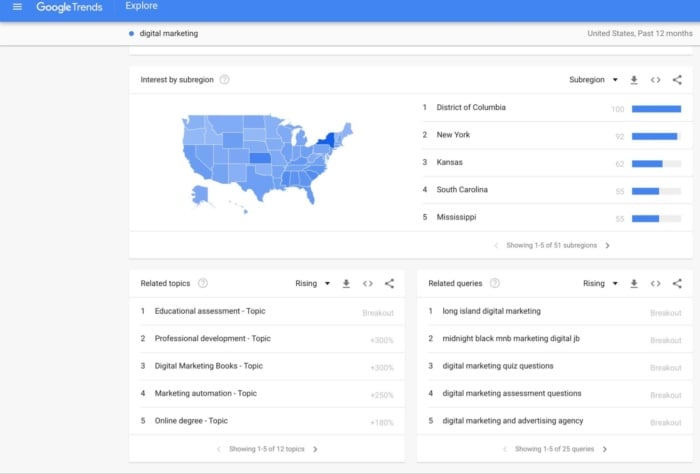
In the “related topics” section, I see terms like education assessment and professional development, which means a list of digital marketing courses or training might do well.
Search the name of your industry and the main key terms you target and see what content ideas pop up.
3. Use the Google Trends Report to Find Topics that Appeal to Gen Z
In 2019, Gen Z officially outnumbered millennials, tallying 32.2 percent of the world’s population.

Even more impactful, Gen Z makes up over 40 percent of U.S. consumers.
Consider this: a third of the world’s population is Gen Z. You’re doing your brand a huge disservice if you don’t consider how to speak to this massive, tech-empowered group.
After you’ve identified topics you know resonate through your search bar exploration, how can you ensure your content resonates with this unique group?
The answer is pretty straightforward.
Your content needs to be more interactive and appealing.
Here’s how to do that:
Create More Interactive Content
The more opportunities audience members have to interact with your content, the more likely they will.

By incorporating interactive elements, you encourage action. Next time you’re planning content, consider including a poll, stickers, or slider that allows your audience to truly engage with your brand.
Personalize Your Messages
Gen Z grew up amid a time of increased personalization. In fact, they’ve come to expect it. Be sure that you use every personalization opportunity to reach this coveted demographic.
Time-Sensitive
Fear of missing out, or FOMO, is still very much a thing. Take advantage of this fear by incorporating time-sensitive offers into your content, forcing your audience members to take action or miss out on a one-day-only deal.
Make Your Content More Visually Appealing
It’s no secret that Gen Zers flock to platforms like Instagram and TikTok, home to bite-sized video content. Take advantage of this content preference by drawing inspiration from the short, visually appealing videos that spread like wildfire.
4. Create Content Around Topics You’re Passionate About
It’s always easier to create compelling content around topics that resonate with you. As you peruse the 2021 Google Search Trends, keep an eye toward topics that resonate personally with both you and your brand identity.
Start by looking at the major search terms in each main topic I listed out above. Let’s say you work or own a coaching business and are looking for more topic ideas.

A quick look at popular “culture” topics shows us doom scrolling is the most popular topic in the culture section. How can you use that to your advantage? By matching it to your brand identity.
As a coach, you might write about how to avoid doom scrolling, how doom scrolling impacts your job search, or create a challenge to encourage your followers to stop doom scrolling and improve their mental health (which was another popular search term, as you might recall!)
After identifying high-performing topics, create a content plan to address them. Will you create blog posts, ebooks, or courses? Can you use these ideas in other areas of your marketing, like paid ads?
5. Identify New Niches
If you’re searching for a new niche, Google Search Trends is a great way to identify rapidly-expanding niches that may have content gaps you can fill.
To see search growth for a particular topic, simply set your search duration to “2003 to present,” so you can see long-term traffic on the topic.

This can also help you see when topics are most popular in a specific year, allowing you to plan your content publication around timeframes when Google users are historically searching for specific terms each year.
For example, topics around “fly fishing” tend to peak in the summer, when the weather’s nice. Tips for Black Friday marketing tend to peak in late November, as you might have guessed.
Frequently Asked Questions About the Google Search Trends 2021 Report
What is the most searched thing on Google in 2021?
Globally, the highest-volume search term was “Australia vs India.” In the United States, the most searched term in 2021 was “NBA.”
How do you find what is trending on Google?
Google releases its year-end search trend report once a year. In these pages, you’ll find the highest-volume search phrases in a variety of different categories, as well as through a geographical lens.
Throughout the remainder of the year, you can visit Google trends to see what the world is searching for.
How can you capitalize on search trends in marketing?
You can use search trends to power your content plan, perform keyword research, find seasonal trends, optimize your SEO strategy for video, and find related terms to outperform your competitors.
What are the search trends for late 2021?
The most popular search trends for late 2021 include mammography, why people are quitting their jobs, back to work bonus, potluck, small business Saturday, and how to become a volunteer firefighter.
Conclusion: Google Search Trends 2021 Report
The Google Search Trends report provides a nostalgic look at the year in review, with pop culture topics like Squid Game and news stories like the disappearance of Gabby Petito. However, they’ve also given us a tool we need to gain greater visibility into search patterns.
By mining these trends for insights into search patterns and behavior, you can create a content plan that speaks to the topics users care about.
The uses of the Google Search Trends report go beyond content ideas. You can also perform in-depth keyword research, use popular trends in your ad copy, and find new niches to target.
As you wade into your 2022 content planning, keep an eye toward the information Google has generously handed over—your click-through rate (CTR) will thank you.
What’s the most useful thing you’ve learned from the Google Search Trends report?
Source: neilpatel.com

B2B Content Marketing Research for 2021: Key Takeaways and Trends
Here are seven key takeaways from this B2B content marketing research report that I believe is important to keep in mind as you plan for 2021 and even 2022.

At Convince & Convert, one of my roles as head of the strategy is to make sure that everything we recommend to our clients is grounded in sound research and a firm understanding of what is happening right now with our clients and their industries.
To that end, we are constantly reading and summarizing reports for our own team.
One of my favorite annual reports is from our friends at the Content Marketing Institute and MarketingProfs, their annual B2B Content Marketing Benchmarks, Budgets, and Trends report.
This year, it’s more important than ever because the ground has shifted under all of our feet, and understanding the world we face during Covid and into 2021 is absolutely vital.
(Full disclosure: I’ve often worked with CMI and MarketingProfs as a speaker, and MarketingProfs is a former client of my company Media Volery, but I’d write about this report anyway because it’s essential information.)
Key Takeaways from the B2B Content Marketing Research Report
Here are seven key takeaways from this B2B content marketing research report that I believe is important to keep in mind as you plan for 2021 and even 2022.
1. Everyone is adapting to this major upheaval.
It’s no surprise that, of those with content marketing strategies, seven in 10 B2B marketers surveyed said they have experienced a major or moderate impact on their content marketing strategies.

As B2B marketers, we have to keep in mind that our customers’ customers are also adapting, so this is a critical time to change our tactics and help our customers adapt to the new reality that their end customers are facing.
If you can provide value to your customers in the B2B space at this time and guide them in how to get more out of their marketing and sales dollars, they’ll not only be grateful, but they’ll be more likely to stick around.
2. There will likely be a lasting ripple effect as B2B marketers adapt.
Of the marketers who have made adjustments, 66% said they have had to make both short- and long-term adjustments.
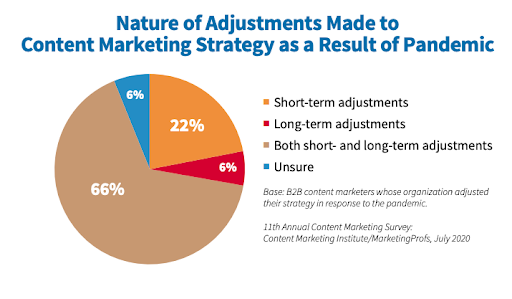
For B2B content marketers, it’s important to lean into the uncertainty that our customers are experiencing. Acknowledge their fear and confusion by providing resources to speak to their challenges.
Produce content that helps them plan short term and/or breaks down their thinking into quarters, so it’s digestible.
3. Are B2B marketers missing the opportunity to target changing motivations?
According to the study, the majority of content marketing changes that B2B organizations made in response to the pandemic related to changes in “targeting/messaging strategy”, the “editorial calendar,” and “content distribution/promotion strategy”—all focused on the operations of content marketing.
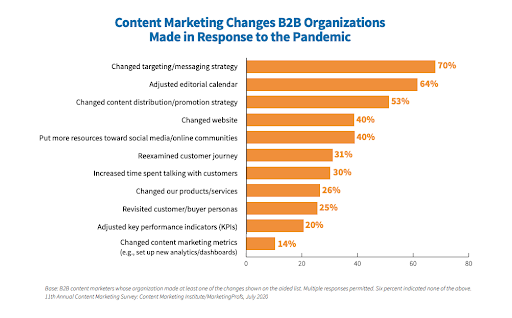
Interestingly, only a quarter of those surveyed indicated that they revisited customer/buyer personas, and less than a third (31%) said they reexamined their customer journeys.
In my opinion, this could be a major missed opportunity, considering that many businesses have shifted how they buy and what they prioritize during this time.
In fact, our own Jay Baer says, “This is the greatest opportunity you will ever have in your business life-time to create new customers.”
Understanding your audience during these times, their journey, and their mindsets will be critical to success. If your competitors aren’t investing there, now is the time for you to get this right.
4. Youtility is essential, now more than ever.
Of those who reported “extremely” or “very successful” content marketing during the last 12 months, 83% of them attributed this success to “the value our content provides.”
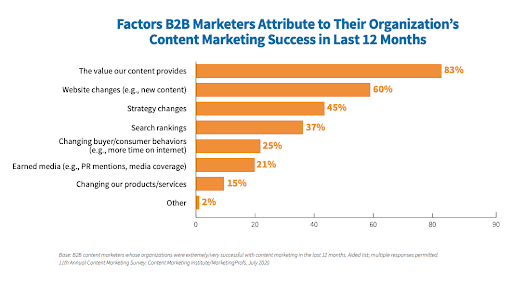
Jay Baer published his seminal book on “marketing so helpful that people would pay for it,” Youtility in 2013, but its lessons are even more important in this current environment because of everything we’ve talked about above.
Your existing customers are more willing to make a change than ever, but so are your prospective customers. So this means that you must build trust with them, so they’ll want to work with you at the end of the day.
5. Paid is here to stay.
According to the report, “72% of B2B marketers said their organization used paid content distribution channels (vs. 84% last year) in the last 12 months. However, the percentage of those using each paid channel increased over last year.”
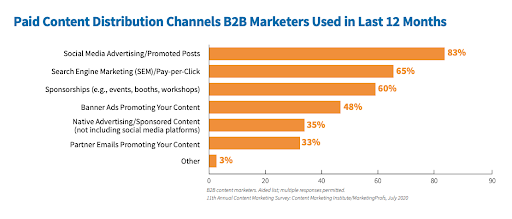
What we believe is that as in-person events go by the wayside, more B2B companies will need to invest in influencer work. In the last seven months, we’ve seen an uptick in companies that want to work with us on their B2B influencer strategies and programs.
6. Outsourcing and partnerships are vital for content marketers.
A whopping 86% of B2B marketers who outsource at least one activity say they outsource (some form of) content creation, far and away from the largest percentage. The next item is content distribution at 30%.
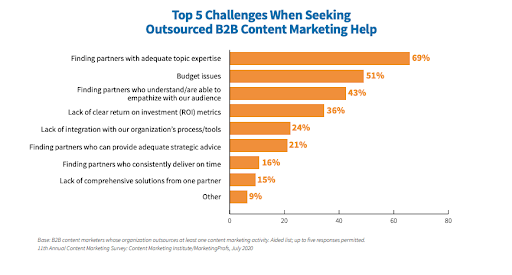
However, the real challenge is “finding partners with adequate topic expertise.” As you can see from this chart, 69% say that their challenge is finding partners with adequate topic expertise.
This is another reason to work with B2B influencers—because oftentimes, they can be topical experts.
We’ve recently worked with SharpSpring, a sales and marketing platform that includes CRM and automation capabilities, to launch their Agency Acceleration Series, which features a variety of experts who influence and are trusted by agency owners.
It’s a good example of a program that both showcases expertise and provides a ton of Youtility.
7. Mastering atomization is going to be key.
As you can see from the chart, companies are willing to spend on content creation and website enhancements, but not so much on staffing/human resources.
Plus, as we’ve seen from the previous chart, we know that “topic expertise” and “budget” are the top issues. So what should we make of the disconnect?

As always, firms are trying to do more with less. That’s not a surprise. But it does mean that creating a content atomization pipeline is a pressing need.
By doing so, we’re taking one piece of content and breaking it into many more pieces of content that can get eyeballs in a variety of places.
Doing more with the content we’re creating will help maximize not only our content but also help make our budgets more efficient.
Beyond Benchmarks to Actions
I hope you’ll take the time to review the B2B Content Marketing Benchmarks, Budgets, and Trends report in full.
It is because there are a ton of other interesting numbers in there, but beyond getting an understanding of how your current approach compares to other content marketers, use this report (and other reports like it).
It will help you to identify the places where you have the opportunity to take a step back, pivot, and invest time or energy in the areas that will make the biggest differences to your business and to your customers.
We must shake ourselves out of the status quo and make our B2B brands as useful to our customers as possible if we are going to be around for the next annual report.
The post B2B Content Marketing Research for 2021: Key Takeaways and Trends appeared first on Content Marketing Consulting and Social Media Strategy.
Source: convinceandconvert.com

Data Virtualization: A Spectrum of Approachs – A GigaOm Market Landscape Report
As the appetite for ad-hoc access to both live and historical data rises among business users, the demand stretches the limits of how even the most robust analytics tools can navigate a spiraling universe of datasets.

Satisfying this new order is often constrained by the laws of physics.
Analytics On-demand
Increasingly, the analytics-on-demand phenomenon, borne from an intense focus on data-driven business decision-making, means there is neither time for traditional extract transform and load (ETL) processes nor the time to ingest live data from their source repositories.
Time is not the only factor.

Volume & Speed
The pure volume and speed with which data is generated are beyond the capacity and economic bonds of today’s typical enterprise infrastructures.
While breaking the laws of physics is obviously not in the domain of data professionals, a viable way to work around these physical limitations of querying data is by applying for federated, virtual access.

Data Virtualization (DV) — A Solution
This approach, data virtualization (DV), is a solution a growing number of large organizations are exploring and many have implemented in recent years.
Data Virtualization (DV) — Benefit #1
The appeal of DV is straightforward: by creating a federated tier where information is abstracted, it can enable centralized access to data services.
Data Virtualization (DV) — Benefit #2
In addition, with some DV solutions, cached copies of the data are available, providing the performance of more direct access without the source data having to be rehomed.
Data Virtualization (DV) — Benefit #3
Implementing DV is also attractive because it bypasses the need for ETL, which can be time-consuming and unnecessary in certain scenarios.
Whether under the “data virtualization,” “data fabric,” or “data as a service” moniker, many vendors and customers see it as a core approach to creating logical data warehousing.
Data Virtualization (DV) — Benefit #4
Data virtualization has been around for a while; nevertheless, we are seeing a new wave of DV solutions and architectures that promise to enhance its appeal and feasibility to solve the onslaught of new BI, reporting, and analysis requirements.
Data Virtualization – A Somewhat Nebulous Term
A handful of vendors offer platforms and services that are focused purely on enabling data virtualization and are delivered as such.
Others offer it as a feature in broader big data portfolios.
Regardless, enterprises that implement data virtualization gain this virtual layer over their structured and even unstructured datasets from relational and NoSQL databases, Big Data platforms, and even enterprise applications which allows for the creation of logical data warehouses, accessed with SQL, REST, and other data query methods.

This provides access to data from a broader set of distributed sources and storage formats.
Moreover, DV can do this without requiring users to know where the data resides.
Various Factors Influencing the Need for DV
In addition to the growth of data, increased accessibility of self-service Business Intelligence (BI) tools such as Microsoft’s Power BI, Tableau, and Qlik, are creating more concurrent queries against both structured and unstructured data.
The notion that data is currency, while perhaps cliché, is increasingly and verifiably the case in the modern business world.
Accelerating the growth in data is the overall trend toward digitization, the pools of new machine data, and the ability of analytics tools and machine learning platforms to analyze streams of data from these and other sources, including social media.

Compounding this trend is the growing use and capabilities of cloud services and the evolution of Big Data solutions such as Apache Hadoop and Spark.
Besides ad-hoc reporting and self-service BI demands being bigger than ever, many enterprises now have data scientists whose jobs are to figure out how to make use of all this new data in order to make their organizations more competitive.
The emergence of cloud-native apps, enabled by Docker containers and Kubernetes, will only make analysis features more common throughout the enterprise technology stack.
Meanwhile, the traditional approach of moving and transforming data to meet these needs and power these analytic capabilities is becoming less feasible with each passing requirement.
In this report, we explore data virtualization products and technologies, and how they can help organizations that are experiencing this accelerated demand while simplifying the query process for end-users.
Key Findings:
- Data virtualization is a relatively new option, with still-evolving capabilities for query or searches against transactional and historical data, in near real-time, without having to know where the data resides.
- DV is often optimized for remote access to a cached layer of data, eliminating the need to move the data or allocate storage resources for it.
- DV is an alternative to the more common approach of moving data into warehouses or marts, by ingesting and transforming it using ETL and data prep tools.
- In addition to providing better efficiency and faster access to data, data virtualization can offer a foundation for addressing data governance requirements, such as compliance with the European Union’s General Data Protection Regulation (GDPR), by ensuring data is managed and stored as required by such regulatory regimes.
- Data virtualization often provides the underlying capability for logical data warehouses.
- Many DV vendors are accelerating the capabilities of their solutions by offering the same massively parallel processing (MPP) query capabilities found on conventional data warehouse platforms.

Data Virtualization Products
Products are available across a variety of data virtualization approaches, including:
- (1) core DV platforms;
- (2) standalone SQL query engines that can connect to a variety of remote data sources and can query across them;
- (3) data source bridges from conventional database platforms that connect to files in cloud object storage, big data platforms, and other databases; and
- (4) automated data warehouses.
Source: gigaom.com

Enterprise Data Governance with Modern Data Catalog Platforms: A GigaOm Research Byte
Table of Contents
Summary
Data catalogs, a category of product in the broad field of data governance, are emerging in popularity.
That popularity has been brought on by the twin enterprise mandates of complying with data regulations and herding the growing number of repositories in the corporate data estate.
But data catalogs are a legacy product category too, originally stemming from simple data dictionaries – essentially table layouts with plain-English descriptions of tables and fields.
Today’s data catalogs have grown in capabilities, importance, and integration with other tools.
In a nutshell, data catalog platforms help organizations inventory their data by documenting data set content, location, and structure; and aligning business and technical metadata.
This organization yields control, and having control helps enterprises:
- Achieve compliance with data protection regulations, through documentation and inventory.
End users know where to get data and will avoid duplicating it.
Organizations can control access to entire data sets where necessary and can better enforce role-based access to data subsets within them.
The EU’s General Data Protection Regulation (GDPR) is in effect now, with very strict fines for non-compliance.
The GDPR’s companion ePrivacy (ePR) regulation is pending, and the California Consumer Protection Act (CCPA) has been passed and will likely be in effect by the time you read this.
These regulations demand the structure and controls that data catalogs provide.
- Improve data lake ROI by making data within the lake more discoverable and increasing the lake’s usability in general.
A well-organized, searchable data catalog makes it easy to find relevant data, analyze it, derive insights, and make decisions with greater speed and conviction.
These are the very reasons most enterprises built their data lakes in the first place.
- Unify the data landscape by creating a consolidated volume of information covering data lake, data warehouse, and operational databases.
Implemented correctly, data catalogs integrate these components through a shared abstraction, helping customers derive new value from older warehouse and operational database assets.
- Bring data and the business closer together, by mapping business entity definitions onto data sets and columns within them.
A great data catalog provides a business glossary that helps business users find the data they need within the context of their own concepts, taxonomies, and vocabulary.
The summary, then, is that catalogs protect enterprises from regulatory jeopardy and benefit them by delivering more value from existing assets.
Today’s data catalogs enable collaboration between custodians of the data (“data stewards” in contemporary parlance) and business users by mapping out the organization’s data, which makes it more usable for analysis, and thereby benefits the organization.
The vendors discussed in this report all provide baseline functionality (discussed in the Definition section, below) and each has its own emphasis.
Broadly speaking, the products break down into those that are more governance-focused, and those that have a penchant for enabling self-service analysis in the organization by data enhancing data discoverability and usability.
Within those two broad categories are sub-emphases, detailed in the diagram below.

Figure 1: Data Catalogs: Categories and Priorities
Each of the above designations will become clearer through the course of this report.
Source: gigaom.com

Revenge of the Data Warehouse: How a Classic Tech Category Has Evolved, and Triumphed
The pressure to leverage data as a business asset is stronger than ever. Enterprises everywhere are eager to devise sound data strategies that are realistic and achievable, based on available budget, and sensitive to in-house technology skill sets.
For a while, it looked like open source, specialized big data compute frameworks, including Hadoop and Spark, were the way to go.
Enterprise organizations found them compelling for reasons of novelty, economics, and the apparent prudence of a future-looking technology.
But those frameworks are at a bit of a crossroads: the hype around them has subsided and — while things are improving — the success rate of enterprise projects involving them has been modest.
Meanwhile, the data warehouse (DW) which, for decades, has been a key technology platform for enterprise analytics, never went away.
Yes, DWs struggled and incumbent DW platforms still do, but recent advances in storage costs and compute scalability, especially in the cloud, have addressed the most important challenges faced by DW platforms.
As a result, we are in a DW renaissance period.
Problems with DWs have largely been solved, petabyte-scale data volumes no longer defeat them and the familiarity and ease of use that kept them viable all this time are now helping them face their open source big data competition and, in many cases, emerge victorious.
Still, if DW platforms have changed, what should enterprises do to build an analytics strategy that integrates them?
Even the most DW-loyal shops will need to look at how DW platforms have evolved and adjust their strategies accordingly.
Organizations that have committed to open source analytics technologies will need to take a second look at DW platforms and consider a strategy that combines both, essentially bringing the data warehouse together with the data lake.
The trick to adapting to the new world of data warehousing is understanding that it is not only the technology that has changed but the applications and use cases for DW technology as well.
DW platforms do not need to be used exclusively for Enterprise DW implementations.
The platforms are now more versatile and can be used for use-case-specific workloads and even exploratory analytics.
In a sense, the DW isn’t just a DW anymore.
Even the juxtaposition of DW and Data Lake has shifted – DW platforms today are increasingly able to ingest raw, semi-structured data, or query it in place.
This means warehouse and lake technology can be used in combination and, sometimes, lake technology will not be necessary.
It is not just the Data Lake and its workloads that are becoming more integrated into the warehouse.
Streaming data, machine learning, and AI are onboarding as well.
In addition, data governance and data protection are starting to enter the DW orbit.
While the familiarity of the relational model, dimensional design, and SQL are back; the application of DW technology now covers territory that may be less familiar.
Moreover, new vendors who have championed or been born in the cloud are emerging in leadership positions.
The new capabilities, new use cases, and new vendors make the space exciting but also difficult to navigate (for newbies and veterans alike).
Enterprise customers will need to understand how DW platforms have morphed and shape-shifted; how best to use, deploy and implement them; combine them with other applications; and understand the key differences between the vendors and their offerings.
Without this knowledge, Enterprise buyers will be frozen in indecision.
With it, they will be armed to leverage today’s DW platforms to their fullest and cherry-pick other technologies that can augment and optimize them.
The end result is that organizations in the know will be ready to analyze all their data, in technologically familiar environments, for full competitive and operational advantage.
In this report, we map out today’s DW landscape in the context of where the technology has been, where it is, and where it is going.
Key Findings:
- The Data Warehouse is alive and well, perhaps enjoying its biggest popularity wave to date
- Open source technology challengers addressed issues of storage costs and horizontal scalability but did not achieve parity in terms of enterprise skill-set abundance, interactive query performance, or acting as authoritative data repositories
- The advent of the cloud has helped DW platforms transcend their vulnerabilities, through the cloud’s power of elasticity for compute and the use of economical, infinitely scalable cloud object storage
- Transcending their vulnerabilities and satisfying customers’ need for familiar SQL-relational platform paradigms has turned out to be a one-two punch for DWs
- Customers need to bring themselves up-to-date on the latest DW innovations and product categories, understanding each in the context of the DW’s historical evolution and market factors
- Customers must correlate DW product categories with corporate cloud (and multi-cloud) strategy
Source: gigaom.com

IoT in the Enterprise: Who’s Doing it, What’s Happening and What’s Working?
Whether in the mainstream media, the tech press or in business circles, a lot has been made of the Internet of Things (IoT). But IoT is about a lot more than internet connectivity for far-flung machines and devices.

It’s about collecting sensor readings and other data from those “things.”
Why is providing value from that data so important?
A confluence of factors in technology and business has given rise to IoT’s utility and the fascination around it.
Trends Giving Rise to IoT
The combination of cloud computing, streaming data, Big Data analytics, artificial intelligence, and the broader prospect of digital transformation have created a readiness in the market for generation, consumption, and analysis of time-series data that is machine- and sensor-produced.

While many of us may think of IoT in the consumer realm, conjuring up images of home automation and turning lights on and off with our personal digital assistants, it’s the industrial realm where IoT really shines.
For the most part, it’s sensor devices found in engine rooms, factories, elevators, automobiles (both self-driving and conventional), turbines, farms, and other industrial settings, that are leading the charge.
Sensors can report all types of conditions including temperature, moisture, pressure, the number of people in close proximity, the working order of a given component, or raw images and video.
Companies can monitor what these sensors are reporting, and can do so repeatedly, over very short intervals.
While sensors used to just tell us if conditions were within a normal range, now they can do much more.
Instead of just reading current conditions, this data can be saved and analyzed so that historical conditions can be correlated with certain phenomena.
Doing this facilitates the construction of predictive models so that certain sensor-reported conditions can be used to forecast specific phenomena. For example, patterns in the temperature of a piece of equipment may provide tell-tale signs of an impending failure.
And it probably goes without saying, being able to forecast such breakdowns before they happen can vastly reduce stress and revenue shortfalls stemming from lapses in operational continuity.
The above provides an operations-based explanation for why IoT is such a phenomenon, but what about the business reasons?
There are several. For one, companies are shifting their computing infrastructure from a mostly on-premises approach to a hybrid approach with some assets in the cloud.
When analytics is one of the workloads that move to the cloud, things get teed up nicely for IoT.

Not only does cloud storage allow for arbitrarily large data sets, but it allows them to grow over time, even geometrically, as necessary.
And since sensor data originates from remote locations, storing it in the cloud works well.
There’s no reason to store data on-premises that doesn’t originate there.
On the other hand, data that does originate from and is stored on-premises may be needed in the analysis work, along with the sensor data.
That means the analytics system in play must be capable of both blending data from different data sets and working in a hybrid on-premises/cloud modality.
In fact, modern cloud-based analytics systems can do this very well, further facilitating the IoT workflows.
Perhaps the most important precondition for IoT, though, is the yearning businesses have to work with data in real-time, acting on new conditions as soon as they arise. IoT data—and the patterns for processing it—are completely aligned with that principle, often referred to as a data-driven culture.

Further, because IoT sensor readings are formatted as time-series data (successive point-in-time recordings of the sensor readings), they lend themselves well to AI and predictive analytics, both of which work extremely well with time-series data, as the predictions are often just additional, extrapolated data points in the series.
All of these technological developments and breakthroughs combine to serve as the cradle for digital transformation, a broad term that describes the journey to data mastery and data-driven outcomes.
In fact, when the essence of IoT is considered, digital transformation is what it’s all about: getting real-time data on the operations of a business, performing immediate descriptive and predictive analytics on it, and acting on the results.
Background on the Survey
With all of that in mind, Gigaom surveyed a large group of Enterprise customers (300 Enterprise IT Executives) to learn about the IoT initiatives in their organizations.
Our goals were to determine the inspiration for IoT initiatives, the business units responsible for pushing them, the groups that provided the funding, as well as those units that led them.
And beyond the quest for general knowledge about which business units play which role, we wanted to know how IT (information technology) and OT (operations technology) collaborated for IoT initiatives.

We also wanted to gain insight into the relative maturity of organizations’ IoT projects, and the organizations’ IoT maturity overall.
Also, as with all Gigaom surveys, we asked several categorizing questions—for example, size of the organization and the industry it works within—up-front, so that we could drill down to, and correlate answers to the other questions with these subgroupings.
Beyond learning who is driving IoT and what relative maturity of organizations doing IoT, we also set out to determine the scope of the projects, the general rate of success in their implementation, and how different companies implementing IoT approach vendor selection, as they proceed from planning to project implementation.
Like IoT itself, the overall goal of this survey was to discern things both descriptive and prescriptive.
We wanted to see what customers have done, how much they’ve covered, how they’ve done it, and what impact these choices may have had on their success.
Source: gigaom.com
Two-Tier Data Storage: A GigaOm Market Landscape Report
Summary:
Most organizations face a growing number of data storage challenges.
The number of applications and services IT departments support are increasing; with users accessing data from everywhere, at any time, and from different devices.
The variety of workloads are increasing as well, with applications competing for resources from the same infrastructure.
The cost of traditional infrastructure is incompatible with the exponential growth of unstructured data, big data workloads, or Internet of Things (IoT) applications.

The traditional classifications of primary and secondary data, that correlate primary with structured data/databases and secondary with unstructured files, are no longer valid.
With data becoming one of the most important assets for organizations, structured and unstructured data are now equally important, and they should be protected and treated accordingly.
A new primary/secondary classification has emerged and is based on the value of data, with data indexation and classification.
Coupling this new classification with a two-tier storage infrastructure can help reduce costs and simplify the process, especially if the two tiers are integrated and data can move seamlessly between them.
Modern applications can now be divided into two families: latency-sensitive or capacity-driven.
The first group needs data as close as possible to the processing engines (e.g. CPU, GPU, etc.) while the latter usually requires easily accessible data spanning multiple devices across the network.
New infrastructure designs must take this division into account to cope quickly with new and ever-evolving business requirements.
In this report, we analyze several aspects of the two-tier storage strategy including:
- Why a two tier-storage strategy
- Different types of tier integration
- How to manage file-based storage in a two-tier storage strategy
- Automated tiering and application-based profiling
- Security considerations about two-tier storage strategy
- Key players
- First steps for adopting a two-tier storage strategy and improving overall infrastructure TCO
Key findings include:
- A two-tier storage policy is easy to adopt and saves money while optimizing infrastructure resources.
- This approach enables improved ROI on infrastructure and makes future investments necessary only where and when they are required, as opposed to months or years in advance.
- The infrastructure layout is highly simplified and optimized to take advantage of the cloud and seamlessly integrate it with the rest of the infrastructure. This also helps to simplify and redistribute budget resources from CAPEX to OPEX.
Source: gigaom.com

CIO Report: Enterprise Data Protection
Summary:
The enterprise data protection market still leverages a traditional approach to solving the increasingly complicated enterprise requirements.
Solutions range from on-premises traditional software to specialized appliances to cloud-based solutions.
Some solutions support a hybrid cloud to meet a specific enterprise’s requirements.
Most of the solutions take a traditional approach to backup and recovery while a few are looking to leverage newer data sources and technologies.
Key findings include:
- The data protection application is starting to disassociate from the underlying infrastructure.
- This opens new options for different delivery methods including the cloud.
- Cloud support exists to widely varying degrees. Solutions may support the cloud as a location to run the data protection application and/or as a source or target.
- Primary data sources are still the focus for most enterprise data protection solutions with limited support for non-traditional data sources including cloud, containers, and endpoints.
- Enterprise data protection solutions are starting to leverage machine learning and artificial intelligence to enhance automation capabilities. As enterprise requirements increase in complexity, so will the reliance on sophisticated automation.
- Strong management tools are essential for any enterprise data protection solution. The increasing degree of complexity makes automation and the overall management tool a core requirement.
- Support for regulatory and compliance requirements is in its infancy. Few products have yet to tackle this challenge. This could be one of the biggest opportunities for enterprise data protection moving forward.
- Simplicity is starting to make its way into enterprise data protection as solutions start to consolidate storage and data protection components into one system.
- Purchase models are moving away from traditional, perpetually-licensed software that runs on-premises to software that runs in a SaaS model from the cloud.
Source: gigaom.com

Data APIs: Gateway to Data-Driven Operation and Digital Transformation
Enterprises everywhere are on a quest to use their data efficiently and innovatively, and to maximum advantage, both in terms of operations and competitiveness.
The advantages of doing so are taken on authority and reasonably so. Analyzing your data helps you better understand how your business actually runs.
Such insights can help you see where things can improve, and can help you make instantaneous decisions when required by emergent situations.
Summary:
You can even use your data to build predictive models that help you forecast operations and revenue, and, when applied correctly, these models can be used to prescribe actions and strategies in advance.
That today’s technology allows businesses to do this is exciting and inspiring. Once such practice becomes widespread, we’ll have trouble believing that our planning and decision-making weren’t data-driven in the first place.

Bumps in the Road
But we need to be cautious here. Even though the technological breakthroughs we’ve had are impressive and truly transformative, there are some dependencies – prerequisites – that must be met in order for these analytics technologies to work properly.
If we get too far ahead of those requirements, then we’ll we will not succeed in our initiatives to extract business insights from data.
The dependencies concern the collection, the cleanliness, and the thoughtful integration of the organization’s data with the analytics layer.
And, in an unfortunate irony, while the analytics software has become so powerful, the integration work that’s needed to exploit that power has become more difficult.
From Consolidated to Dispersed
The reason for this added difficulty is the fragmentation and distribution of an organization’s data. Enterprise software, for the most part, used to run on-premises and much of its functionality was consolidated into a relatively small stable of applications, many of which shared the same database platform.
Integrating the databases was a manageable process if proper time and resources were allocated.
But with so much enterprise software functionality now available through Software as a Service (SaaS) offerings in the cloud, bits, and pieces of an enterprise’s data are now dispersed through different cloud environments on a variety of platforms.
Pulling all of this data together is a unique exercise for each of these cloud applications, multiplying the required integration work many times over.
Even on-premises, the world of data has become complex. The database world was dominated by three major relational database management system (RDBMS) products, but that’s no longer the case.
Now, in addition to the three commercial majors, two open-source RDBMSs have joined them in Enterprise popularity and adoption.
And beyond the RDBMS world, various NoSQL databases and Big Data systems, like Hadoop and MongoDB, have joined the on-premises data fray.

A Way Forward
A major question emerges. As this data fragmentation is not merely an exception or temporary inconvenience, but rather the new normal, is there a way to approach it holistically?
Can enterprises that must solve the issue of data dispersal and fragmentation at least have a unified approach to connecting to, integrating, and querying that data?
While an ad hoc approach to integrating data one source at a time can eventually work, it’s a very expensive and slow way to go, and yields solutions that are very brittle.
In this report, we will explore the role of application programming interfaces (APIs) in pursuing the comprehensive data integration that is required to bring about a data-driven organization and culture.
We’ll discuss the history of conventional APIs and the web-standards that most APIs use today. We’ll then explore how APIs and the metaphor of a database with tables, rows, and columns can be combined to create a new kind of API.
And we’ll see how this new type of API scales across an array of data sources and is more easily accessible than older API types, by developers and analysts alike.
Source: gigaom.com