
Tag Archives for " analytics "

An In-Depth Guide to Google Analytics 4
When it comes to website analytics, Google Analytics is second to none.
With the rollout of the latest release, Google Analytics 4 (GA4), the same can now be said of applications analytics, too.
Google Analytics 4 was designed to be the latest generation of web analytics platforms—providing a base for marketers around the world to effectively analyze important customer usage metrics.
New report functions, enhanced features, and predictive insights make it an essential addition to any current Google Analytics setup.
What Is Google Analytics 4?
Google Analytics 4 (formerly known as App+Web), is a new property available on Google Analytics. It replaces the former property type “Universal Analytics.”
The latest generation of Google Analytics sells itself as focused on customer privacy. This comes in the face of some of the latest privacy laws, such as GDPR and CCPA. With privacy-first tracking, cross-channel data measurement, and AI-driven predictive analytics, GA4 is certainly an advanced property that many websites and apps will benefit from.
Google Analytics 4 Vs. Google Analytics (Universal Analytics)
The most obvious difference between Google Analytics 4 and Universal Analytics is that GA4 is a property that enables you to report on websites and applications. Universal Analytics only supports website analytics.
The measurement model itself is also different between the two.
Google Analytics 4 uses a new model that measures events and parameters. Universal Analytics uses a model based on sessions and pageviews.
That’s not all, however. GA4 has an array of new metrics.
These include engagement metrics such as:
- engaged sessions
- engagement rate
- engagement time
What Are the Benefits of Google Analytics 4?
Google Analytics 4 offers numerous benefits to users. Here are a few that stand out against the older generation of the property.
Cross-Platform Tracking
What happens when users are active on more than one platform? With the old Google Analytics, it was a manual process that took time and effort.
The new Google Analytics 4 tracks both web and app data in one property (hence the beta name of Google Analytics App+Web).
Cross-platform tracking enables you to see the complete customer journey, including acquisition, engagement, monetization, and retention.
You can use GA4 to track the user experience from start to finish—and from platform to platform.
This is done through unique user IDs assigned during app or website login.
With the appropriate gtag.js script, the user ID for each logged-in session will be sent from either the website or the application to Google Analytics. The ID will be reported to the GA4 property and any user metrics will be logged.
When the user logs in again on an alternative platform, the reports will connect the user’s data to their unique ID and pick up where it left off.
This is incredibly useful information for any marketer, as it allows you to better understand the cross-platform experience of your users. The data can also be used to extrapolate information for a generalized demographic and build more accurate customer models.
All Measurements Are Events
With Universal Analytics, page views were the most important metric. This, and other hit metrics such as screen time, events, and transactions, were tracked extensively. The problem is that this gives a myopic view of customer interactions.
With Google Analytics 4, all measurements are events. What does this mean for you?

Instead of measuring at just the session level, GA4 collects and stores all user interactions as separate events. You can still view session-level reporting, but the ability to break it down by interaction means more in-depth reports and insights.
Instead of seeing generalized data, you can now gain a fuller understanding of your individual users when it suits your needs.
AI Insights for Predictive Metrics
While looking at past behaviors is helpful in understanding your audience, it doesn’t enable you to always make proactive decisions. With GA4’s powered predictive metrics, you can make data-driven decisions on a large scale.

What does this look like? For most businesses, predictive analytics can significantly impact retargeting campaigns. The metrics included in GA4 as of this writing are:
- purchase probability
- churn probability
- revenue prediction
With the above metrics, you can create audiences based on their predicted behaviors. For example, users who are likely to purchase in the next 7 days or users that are likely to spend more than $500 in one shop.
These audiences can then be targeted using active Google Ads campaigns or even on social media.
These metrics cannot only help to improve retargeting campaign success, but also improve website performance. You can create custom funnels for different audiences based on their behaviors and needs. The suggestions will continue to improve as more data is collected.
More Control
The greater the control you have over the data, the more you can do with it. While the Universal Analytics property has no shortage of data, it does have a lack of user control. You can create custom reports to a certain extent, but in many cases the customization possibilities are limited.
Google Analytics 4 offers more flexibility than the old Google Analytics. With GA4, you can create your own dashboard, enabling you to see the reports that matter most to your business.
It even works well in conjunction with Google Data Studio so you can create custom visualizations of the data collected.

Even more than greater control over specific reporting, GA4 offers expanded segmentation capabilities.
With GA4, you can create segments based on events which are essentially a subset of events that occurred on your website or application. This enables you to more accurately track customer interactions.
For example, you can create segments on all conversion events that occurred in a particular location. These capabilities make it possible to take a more granular view of your users and their behaviors.
Should I Make the Switch to Google Analytics 4?
While the switch to Google Analytics 4 may seem overwhelming, it’s important to start gathering data for future use as soon as possible. The thing to remember is that Google Analytics 4 can only collect data from the date it is set up and enabled. It cannot collect historical data prior to that time.
There has been no word from Google whether Universal Analytics will become obsolete in the future. However, it’s best to get used to the new property while you still have the time. The good news is you can have both a Universal Analytics property and a Google Analytics 4 property for your account.
They will run side-by-side collecting data so you can begin to accustom yourself to the new property without losing your current reporting capabilities.
How to Set Up Google Analytics 4
Since Google Analytics 4 can be used for your website or application (or both), there are two separate setup processes. They are outlined below.
Alongside an Existing Property
If you currently have a Universal Analytics property for your website, then the setup of a Google Analytics 4 property can be completed with the GA4 Setup Assistant.
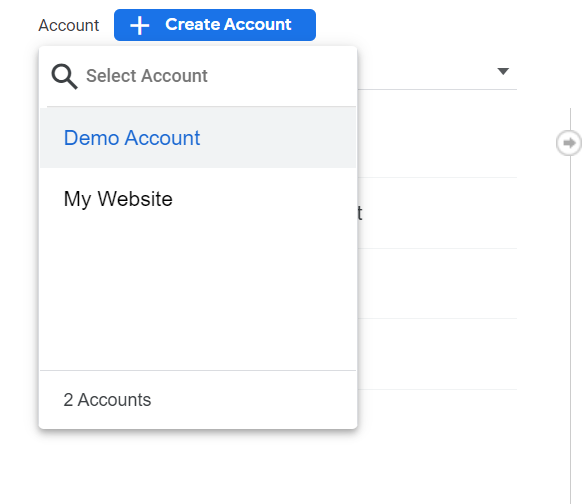
In Google Analytics, click “Admin” on the lower left of the screen.
In the Account column, select the desired account:
In the Property column, select the Universal Analytics property that currently collects data for your website:
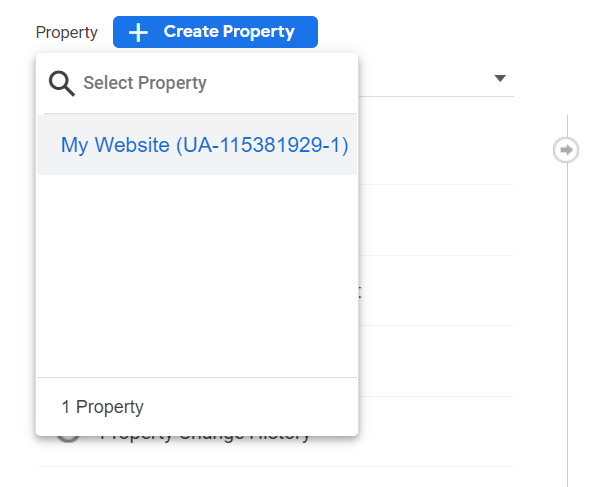
In the Property column, select GA4 Setup Assistant:
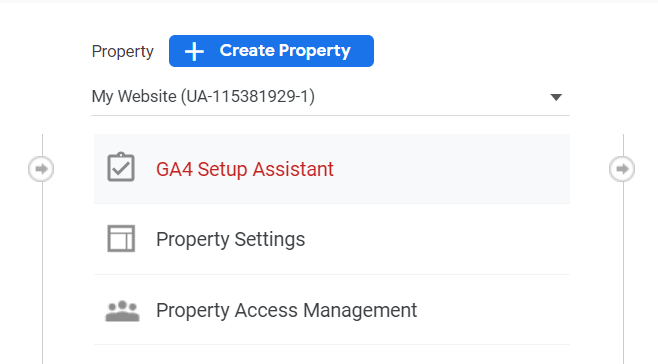
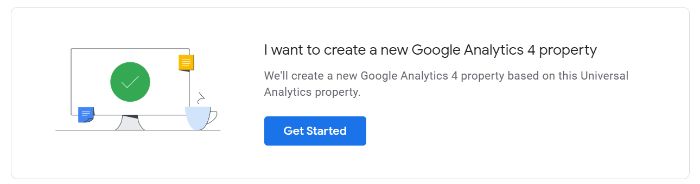
Click “Get started” under “I want to create a new Google Analytics 4 property:”
If your site uses the gtag.js tag, you can select “Enable data collection using your existing tags.”Click “Create Property.”
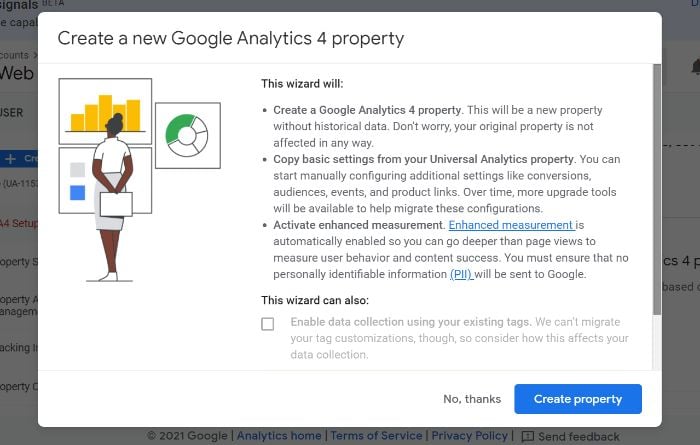
If you are unable to “Enable data collection using your existing tags,” it’s for one of three reasons:
- Your website builder/CMS doesn’t yet support the gtag.js tag.
- You use Google Tag Manager.
- Your website is tagged with analytics.js.
In all three cases, you’ll need to add the tag yourself.
Google Analytics for Firebase
To upgrade your Firebase account to Google Analytics 4, follow these steps:
- Log in to the Firebase console.
- Go to Analytics > Dashboard on the left panel.
- Click “Begin upgrade” in the banner at the top of the page.
- Follow the on-screen instructions to complete the upgrade.
Once upgraded, you can find app analytics in both the Firebase console and Google Analytics.
Frequently Asked Questions About Google Analytics 4
What is Google Analytics 4?
Google Analytics 4 is a new analytics property offered by Google. It enables users to analyze data from websites, apps, or both websites and apps.
What is the difference between Google Analytics 4 and the old GA?
The main difference between Google Analytics 4 and the old GA is in what the two different property types track. Google Analytics 4 can track the analytics of both websites and applications, while the old GA can track only website analytics.
Is Google Analytics 4 free?
Similar to Universal Analytics, Google Analytics 4 is a free property type. There are no costs associated with using one (or more) GA4 properties on your account.
Are they getting rid of the old Google Analytics?
As of this writing, the “old” Google Analytics (Universal Analytics) is still available. This is unlikely to change in the near future. However, Google will likely discontinue Universal Analytics sometime in the future so as to focus on the continued development of GA4.
An In-Depth Guide to Google Analytics 4: Conclusion
When used to its fullest potential, Google Analytics is a powerful analytics tool that can provide invaluable insights. This is why it’s important to upgrade your account when possible. The latest upgrade available to users is the new property, Google Analytics 4.
There are numerous benefits to GA4, including cross-platform tracking, more control over data, and AI-driven insights. When you create a new GA4 property, it works alongside your current Universal Analytics property while also allowing you to gain additional data for future use.
While UA is available indefinitely, the transition to GA4 isn’t mandatory but it’s highly recommended.
Fortunately, setting up a GA4 property on your website or app is easy. The steps as outlined above should take you less than 10 minutes to complete so there’s no excuse to put off the transition.
Which of Google Analytics 4’s features are you most excited about?
Source: neilpatel.com

6 MarTech Trends in 2021 and Beyond
Are you hoping to identify MarTech trends that can help your campaigns be more effective and run more smoothly?
As our marketing capabilities evolve, so do the tools we use to measure our successes and how we achieve that success.
In this blog, we unpack the six biggest MarTech trends looming over the marketing industry and how you can use them to your advantage.

Disclosure: This content is reader-supported, which means if you click on some of our links that we may earn a commission.
What Is MarTech?
Marketing technology, or MarTech, as it is more commonly known, refers to software and platforms that help individuals or organizations achieve marketing goals.
This term is very inclusive, covering everything from email templates to data analytics.
While every individual, agency, or company has unique MarTech needs, the constantly-growing field is making great leaps to fill any open niche.
Over the past twenty years, the field has seen truly exponential growth.
Today, being a marketer doesn’t necessarily mean you have to be incredibly tech-savvy, but it does mean that you need to understand the benefits of tools that can improve your strategy and help you reach your goals.
Your competitors are likely using MarTech to help their campaigns succeed.
If you’re not looking toward how you can automate, optimize, and ideate your campaigns through MarTech, it’s time to start.
Examples of MarTech
As we mentioned above, MarTech is a very wide umbrella.
However, some forms of MarTech are more common than others.
These include:
Email Marketing

With more than 50 percent of survey respondents copping to checking their email in excess of ten times a day, it’s no wonder that email marketing is an easy way to try to reach your target audience.
While the operative word in that sentence was try, marketing automation tools can get you that much closer to your goals.
To reach them, you need tools and platforms that not only disseminate your emails but provide in-depth analytics that gives you a real-time view of reader practices and interactions.
As email marketing continues to grow and evolve, the demand for personalization in this medium will also continue to grow.
Marketers should use automation and AI to deploy targeted emails engineered to attract a particular audience segment.
To achieve successful personalization, use data to assess customer habits and preferences for each audience segment and then craft corresponding templates.
Then your MarTech tool can do the rest.
Content Management
While managing your website content used to be a time-consuming, exhaustive process that took hours of coding, new marketing technology has automated cumbersome processes, allowing marketers to dedicate time to other important pursuits.
Content management systems (CMS) have evolved over the years, now equipped with the capabilities to develop the following kinds of websites (along with many others):
- social networking
- blogging platform
- static website
- news
- online store
Predicted to achieve a compound annual growth rate (CAGR) of 16.7 percent, as CMS capabilities grow, so will collaboration and planning tools that unite workflows to allow complete management of content from creative to back-end development.
Data Analytics
Today, marketers can harness the power of data analytics to gain an understanding of customer preferences and behaviors—including how they shop, where they spend their time, and how they discover new offerings—as well as market trends.
MarTech tools that allow marketers to dive deep into these data sets are invaluable, as they provide never-before-seen maps of how consumers operate online.
By tracking online behaviors, marketers gain a deeper understanding of their customers.
As MarTech data tools become even more intuitive, marketers will have even more visibility of customer journeys, following them from initial interest to final purchase.
These insights will be captured through cookies and CTR, among other trackers.
As the tools become more refined, so will understanding of consumer behavior, allowing marketers to readjust their strategies.
6 MarTech Trends
To help you decide which MarTech offerings you want to add to your stack, we broke down the six biggest trends that are likely to impact both the MarTech world and the marketing world well beyond this year.
1. Increased Spending on Analytics
If you’re tempted to bypass adding an intuitive analytics tool to your MarTech stack, don’t.
These tools can help you gain a better understanding of nearly every aspect of your marketing campaigns, from buyer behaviors to conversion rates.
In fact, researchers expect marketing analytics budgets to grow by 61 percent over the next three years.

That’s huge.
You don’t want to miss out on getting in early on a tool that can quite literally change the way you see your business.
Some of the many benefits of marketing analytics tools include:
- viewing real-time, comprehensive outcomes of marketing efforts across channels
- improving lead generation through actionable insights
- gaining insights into customer behavior and preferences
- using predictive analytics to enable your business to be proactive rather than reactive
2. Higher Emphasis on Personalization
We nodded a bit toward the importance and growing prevalence of personalization in marketing campaigns.
In short, this strategy means delivering individualized content to audience members.
This personalized route builds a connection with consumers, treating them as individuals rather than a mass market.
Some common (and growing) opportunities for personalization include:
- targeted emails
- custom video messages
- product recommendations
- social media
In the coming years, this prevalence will only grow, and marketers who don’t use tools to aid them in personalization will fall behind.
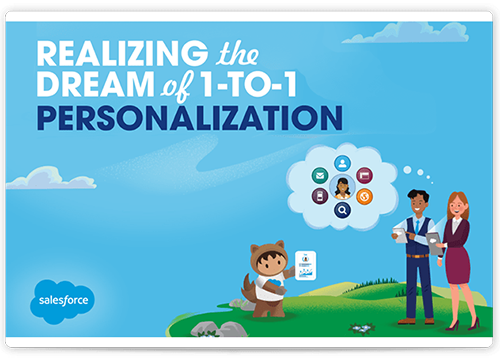
In fact, 99 percent of marketers claim personalization helps advance customer relationships, and 44 percent of consumers say they would be willing to switch to a brand that better personalized its marketing material.
If you’re not taking advantage of learning more about your would-be customers through tools and data, you’re missing out—not only on reaching customers more strategically but also on building relationships.
3. Transition Away From Third-Party Cookies
If you’re an advertiser or marketer who has relied heavily on third-party cookies, you may be in for a bit of a shock.
In 2020, Google announced its plan to phase out third-party cookies within two years.
With Google Chrome composing almost 65 percent of the web browsing market according to StatCounter’s data below, this move will have a dramatic impact on how marketers gather data.
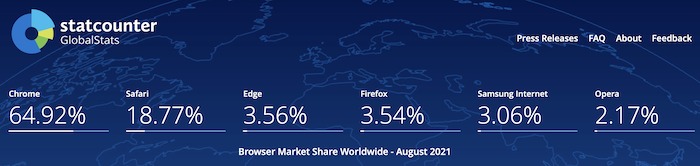
If in the past, you relied on information from cookies to gain an understanding of consumer behavior and identity, you’re going to need to recalibrate your strategy.
Recently, Adobe found two in five brands are not prepared to transition away from cookies, indicating businesses do not have a strategy for gathering consumer data post-cookie.
After the transition is final, marketers will no longer be able to capture individual consumer data.
To prepare for this future, digital marketers must align with the trend of personalization to reach and understand their intended consumers.
4. Higher Need for Data Privacy and Security
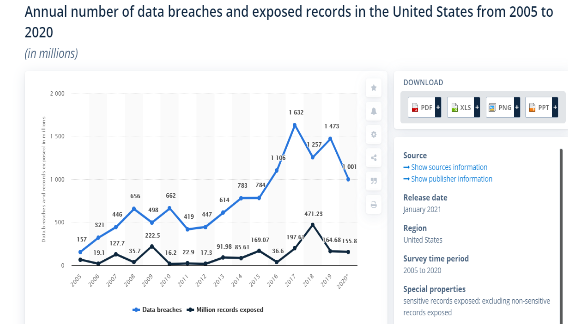
If you’ve been keeping an eye on the news, you know that data breaches are on the rise.
The United States alone has seen data breaches grow from 660 annually to over a thousand within the past decade, according to Statista.
If you think this number doesn’t apply to you, think again.
Your website and consumer data are among your business’ most valuable assets.
You need to protect them from malicious attacks at all costs.
5. Increased Importance of Campaign Automation Tools

Marketing automation can make every aspect of your marketing campaign easy.
By using these tools, you reduce time spent, error, and unnecessary cost.
We’re not the only ones who think this way: The marketing automation market is primed to grow 8.55 percent annually, with 51 percent of companies already taking advantage of these tools.
- Time-saving: With tools that automate time-consuming processes like project management, all members of your team will rejoice in the sheer amount of time they can reclaim after implementing these tools.
- More effective spend: By pinpointing processes that devour valuable time and treating them with automation software, you can use your budget much more effectively, saving both time and money.
- Scalability: MarTech automation tools scale with you.
If you’ve got a big vision for your organization, these tools fit your business needs for today and tomorrow.
- Concrete measures of success: We’ve talked about the importance of data and metrics a lot in this article.
All MarTech automation tools come with data insights that allow you to track everything from productivity to campaign spend.
As you assess your organization’s needs, look at how marketing automation tools simplify your processes and streamline campaign creation.
The benefits of marketing analytics tools include:
6. Growing Importance of Direct Mail
Thought direct mail was dead?
Think again: Forty-two percent of direct mail recipients engage with your send either through reading or scanning.
Further, 73 percent of Americans prefer direct mail marketing, as it allows them to read the piece at their leisure rather than forcing immediate consumption.
This year and beyond, you should reassess your organization’s direct mail strategy to see if there are new (or overlooked) avenues for you to contact your prospects directly through their physical mailbox, according to Who’s Mailing What:
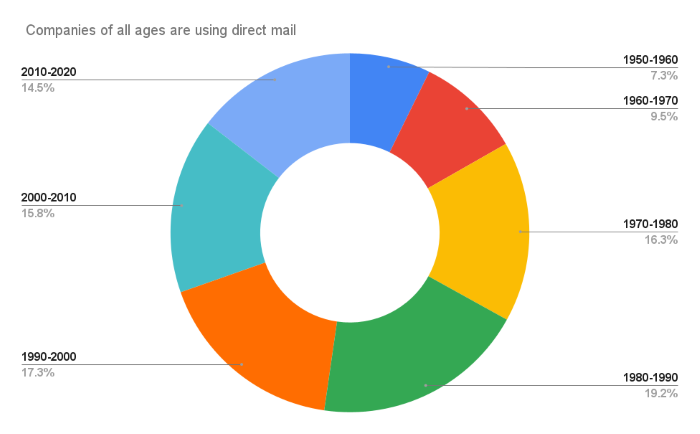
Outside of the above statistics, benefits of direct mail include:
- opportunities for personalization
- builds familiarity and trust
- easy to track
- complements your digital campaign
- cost-effective
MarTech Frequently Asked Questions
FAQ: 1
What Is MarTech?
Marketing technology, or MarTech, as it is more commonly known, refers to software and platforms that help individuals or organizations achieve marketing goals.
This term is very inclusive, covering everything from email templates to data analytics.
FAQ: 2
Is MarTech a Good Investment for My Business?
Yes. With MarTech making up 30 percent of North American marketers’ business budget, you would be well-advised to take advantage of marketing automation tools and platforms that can help you take your campaigns to the next level.
FAQ: 3
What MarTech Trends Will Dominate the Market?
While there is a slew of MarTech trends that reshape the market year after year, we can confidently report that these six trends will be game-changers in the MarTech world:
- increased spending on analytics
- higher emphasis on personalization
- the transition away from third-party cookies
- increased need for data privacy and security
- the increased importance of campaign automation tools
- the growing importance of direct mail
FAQ: 4
Is Direct Mail Still a Good Marketing Strategy?
In a word, yes. Direct mail is still an extremely effective marketing strategy.
While there’s a lot of conversation around digital marketing, this classic mode of reaching potential customers is as effective as ever.
Want proof? Forty-two percent of direct mail recipients actually read what you’re sending them.
Compare that to your average email clickthrough rate (CTR), and you’ll understand the true, measurable value of direct mail.
MarTech 2021 Trends: Conclusion
As marketing needs and customer predilections continue to change, so will the tools we use to meet them.
However, the six marketing trends outlined in this post are here to stay.
To help your organization grow with these MarTech trends, be sure to invest in software that can help you achieve all of your marketing goals.
Tools are meant to be used—be sure you’re taking advantage of them to outmaneuver your competitors.
What’s your prediction for the biggest marketing trend in 2021 and beyond?
Source: feedproxy.google.com

9 Great Mobile App Analytics Tools
You’ve done the incredible—you’ve built an app and started marketing it. While congratulations are in order, making the app is just the first step on your path to app success. The next (and arguably most important) step is optimization.
With consumers spending four and a half hours per day on their phones, it pays to make sure your app is earning some of that heavy time-spend.
And better visibility can pay. On average, consumers spend $120B in the app store and $190B on mobile ad spend.
You can check traffic and user metrics on mobile app analytics to make your app as successful as possible.
Here’s what you need to know about mobile app analytics and which tools are most effective at helping you dig into the data.
Mobile App Analytics
Mobile app analytics aren’t too different from their web counterparts; they track and analyze user activity and events on apps.
Using an app analytics tool gives you access to invaluable insight into how your app works and highlights improvement opportunities.
By seeing how users interact with your app, you can optimize your app to be as user-focused as possible.
Why Analytics Are Crucial for Your Mobile App
Without visibility, your app may fall short of satisfying your users’ needs — regardless of how beautiful or useful your app is.
When that happens, your users will look elsewhere to have their needs met.
By implementing mobile app analytics, you not only equip yourself with the tools necessary to better understand your app’s performance, but you also benefit in these four key areas:
- Real-time ROI assessment: Enhance your app value and, ultimately, increase your ROI by gaining a better understanding of customers through data.
- Data-driven strategies: With increased access to data, you can pinpoint specifics that can drive future campaigns. With clear visualization of past successes and failures, you can recalibrate your approach with data-driven strategies.
- Personalized strategies: By segmenting and targeting audiences with more specificity, you’re more likely to provide them with what they want or need. By using app analytics, you can identify these populations and start targeting them with customized strategies.
- Goal tracking: App analytics allow you to determine which acquisition channels are working for you. By identifying these channels, you can dedicate more focus here and replicate the approach.
While these four areas aren’t the only advantages of implementing a mobile app analytics tool, understanding these categories is vital to overall app success.
What KPIs You Should Track for Your Mobile App Analytics
While it’s easy to get lost in the sheer amount of mobile app analytics available, there are seven crucial key performance indicators (KPIs) you should be tracking to gauge user engagement and your mobile app’s overall success.
- Retention rate: This metric identifies the percentage of customers that continue to use your app. Conversely, this figure also alerts you to the number of customers you’re losing due to churn.
- Lifetime value (LTV): This formula helps you assess what your customers are worth over the “lifetime” of their relationship with your business.
- Uninstalls: Tracking the number of people who uninstall your app is vital to understanding why those people uninstalled your app.
- Cohort Analysis: This analysis focuses on segmenting users by traffic source, country, and device and analyzing the associated metrics.
- ROI: This number represents what you’ve spent versus what you’ve earned on a particular effort.
- Cost per acquisition (CPA): This figure lets you know exactly how much you’re spending per acquisition.
- User growth rate: This figure represents the number of new users within a specific time frame.
While these seven KPIs are by no means the only helpful app analytics you can track, they provide a comprehensive view of your app’s success and highlight areas in which improvement is necessary.
What’s The Difference? SEO vs. ASO
Just like optimizing any web page for SEO is vital to your search success, it is imperative to optimize your app for app store optimization (ASO).
ASO refers to the continuous process of measuring, testing, and assessing existing app store marketing strategies to increase your app’s visibility and driving downloads. The higher your app ranks in the app store, the more likely potential customers are to see your app.
While SEO and ASO processes are similar, they also have some significant differences, including the ways users search the web versus searching an app store.
While the web is primarily used to answer questions, the app store is used to search for a specific product that matches the searcher’s intent.
This means you’ll need to use different strategies to rank high in the app store versus search engines like Google.
This is why you don’t want to just use web-based analytics tools for SEO to track ASO.
Best Mobile App Analytics Tools
With a slew of mobile app analytics tools available, it can be challenging to figure out which ones are the right choice for you. These nine tools represent some of the most effective platforms that can help you make your app climb toward the top of the search bar.
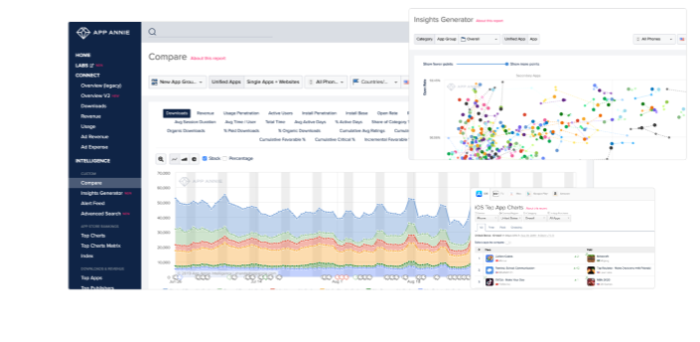
App Annie
App Annie is a mobile and data analytics platform that provides unprecedented views of both your app’s data and other in-market apps. With both a paid and free subscription option, App Annie can help your app stand out among the digital crowd, whatever your budget.
What Platforms Support It?
What Data Does It provide?
How to Use It?
iOS, Android, Windows Phone.
The free version of App Annie provides ratings, rankings, reviews, charts, and app details, while the premium pricing plan adds ASO options, download and revenue estimates, usage estimates, advertising estimates, and audience estimates.
Use App Annie to access data to help you determine how to best optimize your app. Through the App Annie platform, you gain immediate access to the organization’s technology innovations and data sets, allowing you access to shared data, identify opportunities, and the ability to craft successful campaigns.
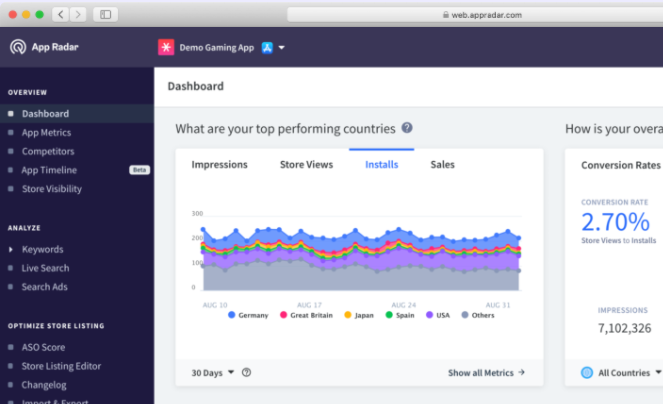
App Radar
App Radar is all about making your life easier. It offers several tutorials to help you optimize your ASO from the ground up. The mobile analytics app comes with keyword tracking and research functionality, helping you build a solid ASO strategy.
What Platforms Support It?
What Data Does It Provide?
How To Use It?
Android, iOS, Windows Phone.
Key metrics tracking, localization, keyword rank tracking, keyword research tools, and more.
Use App Radar to research keywords and track competitors’ search strategies. As you build your own approach, use App Radar’s suite of tools to optimize your ASO.
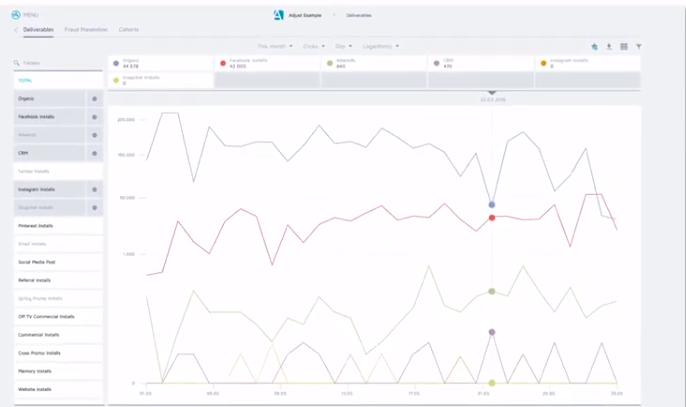
Adjust
Adjust is a mobile analytics app designed to help you identify and build your user base. This mobile analytics app tracks hourly trends assesses, LTV, and analyzes cohorts.
Adjust also allows you to aggregate lifetime user data in a single dashboard. Also noteworthy is the platform’s Fraud Prevention Suite, which protects your app from fraudulent activity.
What Platforms Support It?
What Data Does It Provide?
How To Use It?
Android, BlackBerry, HTML5, iOS, Windows Phone.
Insights on churn, ROI, in-app interactions, LTV, event funnels, and more.
Use Adjust to view and understand patterns of user behavior. By identifying these patterns and metrics, you can recalibrate your app for your user and extend user engagement with the app.
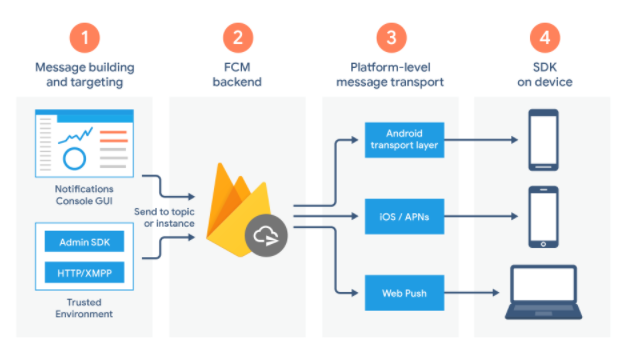
Firebase
Firebase is Google’s free mobile app analytics platform that supports developing, improving, nurturing, and growing your app by displaying all metrics in a single central location.
The app aggregates user data and shares it via an immersive dashboard, allowing you a unique view of the actions happening in and around your app.
What Platforms Support It?
What Data Does It Provide?
How To Use It?
C++, iOS, Unity, and Android.
The number of users and sessions, session duration, operating systems, device models, geography, first launches, app opens, app updates, in-app purchases.
Use Firebase to identify specific audiences through segmentation. Once you’ve broken out these subsets, you can start targeting these audiences through in-app notifications or other strategies.
App Analytics
App Analytics is Apple’s mobile analytics app that provides specialized analytics for apps published in the Apple App Store.
This mobile analytics app gives you specific visibility into user interaction within the App Store, relaying how users discover your app.
What Platforms Support It?
What Data Does It Provide?
How To Use It?
iOS
This mobile analytics app provides user engagement, App Store impressions, sales and trends, and user segmentation.
Use this app to understand how users find your app in the store and replicate this experience for your target consumers.
Tune
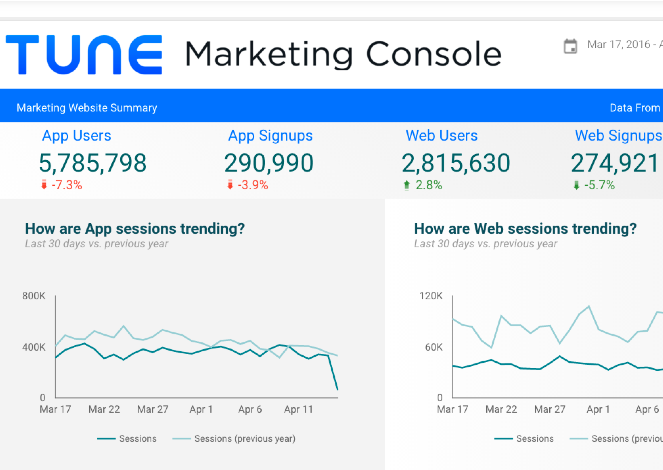
Tune is your solution for measurement and engagement throughout the customer journey, tracking a user’s trajectory by monitoring movement and unifying cross-channel touchpoints.
What Platforms Support It?
What Data Does It Provide?
How To Use It?
Android, iOS, tvOS, Javascript, Windows Phone.
Tune provides ROI, cohort ingestion, impression, click, event measuring, and more.
Use Tune to gain a complete view of the customer’s journey throughout your campaigns. By providing you with real-time data, Tune can help you identify specific improvement points with your strategy.
Kochava
Kochava is a platform designed for tracking engagement, LTV, and user acquisition. Through this mobile app analytics platform, you can view vital data points and build user groups. This platform allows you to analyze ROI through pinpointed data.
What Platforms Support It?
What Data Does It Provide?
How To Use It?
Android, iOS, tvOS, Windows & Xbox One, Unity, ReactNative, Cordova, Adobe Air, Xamarin, Web SDK, Corona Labs, Adobe DPS, Adobe Analytics.
Retention analytics, real-time ROI, location-based marketing, channel attribution, contextual targeting, and much more.
Use Kochava’s data points for real-time visualization of campaign performance and engagement, targeted audience identification and creation, targeting, and prevention of mobile ad fraud.
MixPanel
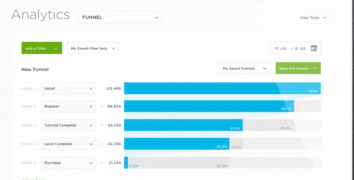
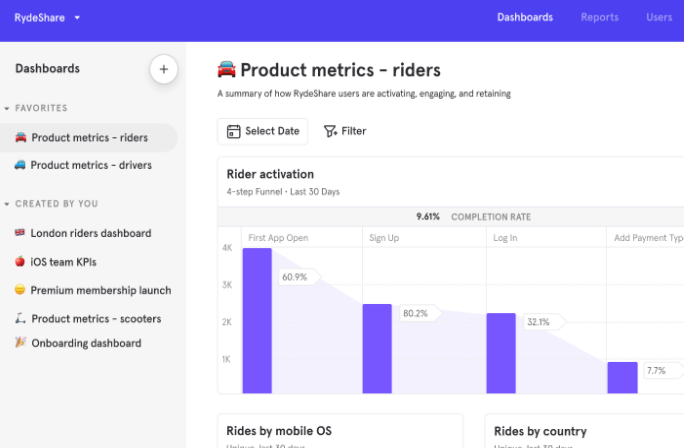
MixPanel is chock-full of unique analytics tools, including a funnel analysis and its uniquely-titled engagement tracker, the Addiction Report. These tools allow you to understand which strategies increase conversion, retention, and engagement.
What Platforms Support It?
What Data Does It Provide?
How To Use It?
iOS, Android.
Retention rate, churn, campaign segmentation, funnel analysis, and more.
MixPanel comes with interactive reports so you can pull data quickly and easily. This interactive feature provides answers to all of your audience engagement questions in seconds.
Flurry
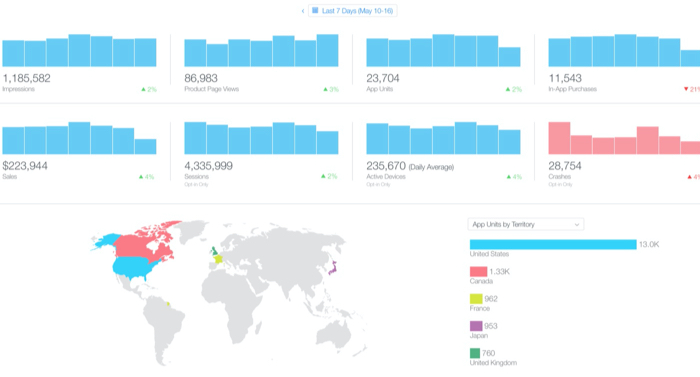
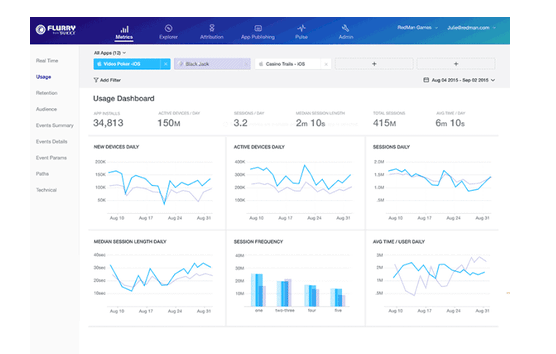
Flurry Analytics is an extension of Yahoo’s Develop Network. This mobile app analytics platform lets you track new users, active users, and sessions via a single dashboard.
What Platforms Support It?
What Data Does It Provide?
How To Use It?
iOS, Android, React Native, watchOS, Unity.
Installs, sessions, time spent, user journeys, custom events, user segmentation, and more.
Use Flurry Analytics to see app performance easily. Flurry also comes equipped with crash reporting, which helps you identify issues and fix them before they impact performance — and customer satisfaction.
Conclusion
Whether you’re just beginning your app-marketing journey and looking to increase visibility, or if you’re looking to delve into the nitty-gritty of advanced data, you need a mobile app analytics tool to help you navigate the realities of ASO.
While there are tons of mobile analytics apps available to choose from, the nine tools I highlighted above offer detailed information about your users and provide unique data points that can highlight patterns of behavior.
Armed with these new metrics, you make your app irresistible for your targeted audience.
What’s your favorite mobile app analytics tool?
The post 9 Great Mobile App Analytics Tools appeared first on Neil Patel.
Source: neilpatel.com

The Metrics that Matter for Your Business (And Where to Find Them)
There’s one thing that every business owner has in common: they want their business to succeed.
It doesn’t matter what industry they’re in, what product they sell, or what problem they solve. Every business owner wants to rise to the top…
…But how?
Most people know what success feels like… but what does success look like?
Contrary to popular belief, this doesn’t have to be super complicated to figure out. Because, although success could look slightly different depending on what you do, almost every business can track success with one thing: the right metrics.
It’s a methodology for tracking growth that Monique Morrison, Co-Founder of Jeronimo Digital Solutions and a DigitalMarketer ELITE Coach, uses for her clients every day. She spoke at her recent DigitalMarketer workshop about the power of metrics, and how to use them to project and achieve growth for your business.
Why High-Level Success Metrics Are Important
Using the right metrics to track how your business is doing is a surefire way to tell if you’re growing your business. They’re trackable, concrete, easy to understand, and they take the guesswork out of the process.
You can track where you are right now and how that compares to this time last month or last year. And, most importantly, you can use those numbers to project what success will look like a year later.
When we map out what went right and what went wrong with our business, looking to the past is great. But none of it matters unless we figure out how to take what we learned from the past and apply it to the future.
Tracking the right metrics gives you the milestones and checkpoints your need to hit by helping you evaluate exactly what you were able to do in the past.
Reliable ways to quantify success can’t be undervalued. In an evolving business world where you are always looking for an edge on your competition, it can often be better to look inside instead of outside.
Tracking your success metrics allows you to bring something concrete to the table when you are figuring out what worked really well and what didn’t work so well at all.
And the best part is you don’t have to spend a dime to track your own metrics. It only takes time and a little bit of effort.
What Metrics Matter
Truthfully, there are lots of metrics that could matter for your business.
But there are some general metrics that are helpful for every business to keep track of. But that also largely depends on if you’re a project/service-based business or an ecommerce/retail business.
Project and Service-Based business will need to track:
- Revenue month-by-month
- Sales count month-by-month
- Lead conversion rate
- No-show/cancellation rate
- Landing page conversion rate
- The average cost per click and click-through rate
Ecommerce and retail businesses will need to track:
- Revenue month-by-month
- Sales count month-by-month
- Unique visitors by month
- Average ad cost per click and click-through rate
These are the stats that matter the most for your business because they are the ones that will give you the bird’s-eye view of when things are going right. These metrics are very broad and account for a culmination of all of the work that you’re doing. This means they all translate to whether there is money trickling into your business’s bank account.
Let’s do a deep dive as to why these stats are important.
Revenue Month-by-Month
Revenue month-by-month is the metric that every business should be tracking, regardless of industry or niche, to measure and project growth. It’s literally the number that tells you how much money is flowing into your business, and one that you definitely already have your eye on. Without tacking it, you’re going to be underprepared to do even basic business analysis.
There is only one part of this metric that could use explanation: the timespan. Although some companies may elect to do a formal evaluation of their revenue on a yearly basis, a monthly evaluation is more effective.
That way you can see the way your revenue fluctuates with different promotions or marketing strategies, and then you can learn how to analyze and adapt those strategies in a timely manner.
If you try to track it on a weekly basis, you’re going to risk overreacting to inconsequential shifts. And the last thing you want to do is drive yourself insane.
Monthly tracking is the way to go. As for finding those numbers, you need to look no further than your books or your bank statements. If you have a designated accountant, ask them. It’s that simple, but it really is important.
Sales Count Month-by-Month
Similar to revenue, this is important for every business to track. Your sales count lets you see how many sales you’re making and the money you’re bringing in, but it also adds important context to your revenue number.
That’s because this metric is analyzing the number of sales, not the amount of money. It’ll allow you to look at your revenue and understand if you’re converting a bunch of small sales, or a few really high-dollar sales.
That will let you analyze the kind of audience you need to be targeting, letting you optimize your marketing plan.
You can also use it to find the customers giving you those high-dollar sales, so you can send them an exclusive deal as a little thank you.
To find this number, you can look in your ecommerce platforms or keep a manual count if you’re a brick and mortar business.
Average Ad Cost per Click And Click-Through Rate
Both of these metrics will let you gauge the effectiveness of your online advertisements. It tracks not only the amount of money you’re paying to have them seen, but also how often people actually click and interact with them.
It’s important because digital advertising is one of the cornerstones of any great marketing strategy and knowing how to optimize your ads is essential to achieving growth.
To find these numbers, look no further than the platforms that you’re advertising on. Facebook and Google, as well as any other platform that you may be on, will provide these statistics for you. All you have to know is what they mean.
Unique Visitors by Month
Tracking unique visitors is an important task for ecommerce businesses because their business is entirely online. It’s the same reason brick-and-mortar businesses like to keep track of how many people are coming in and out of the store. If you can’t get people through the (virtual) door, you’re never going to have a chance to sell anything.
Knowing your unique visitor count can also help you gauge the effectiveness of your advertising and SEO, as well as the persuasiveness of your landing and product pages. If people aren’t visiting your website, then you know there are probably changes that you can make to help generate more traffic and, in turn, more sales.
If your number of visitors is high but your sales are low, then you’ll know that your advertising and outreach aren’t the problems.
You can find this statistic on the dashboard of your website, as well as through Google Analytics and even some of your advertising platforms.
Lead Conversion Rate and No-Show/Cancellation Rate
Although these stats are different, they’re also one in the same—mainly because it’s easy to track them both at the same time.
For project and service-based industries, a large portion of your job is lead generation. Your goal is to create leads and then convert them into customers, and these statistics will help you determine exactly that. Are you turning leads into customers?
Of course, you want your lead conversion rate to be high and your cancellation rate to be somewhat low. But it’s important to keep track of both because it will paint the most complete picture.
By comparing them side by side, you’re going to be able to see the rate at which you convert. Then you can use that to project roughly how many new clients you can expect to get over any given period of time doing what you’re doing. Then you can have a baseline when you try new things to raise that lead conversion rate.
As for finding this data, you can find it in your Google Analytics or turn to your CRM software. Anywhere you track or organize potential clients, you can track how effective your lead generation (and closure) is.
Wrap-Up
Remember that these stats are important because they not only show what all you’ve been able to accomplish, but they also let you project what you’ll be able to accomplish in the future.
And having a good idea of where your business is going is one of the most powerful tools you can have.
Numbers don’t lie—that’s why metrics are your business’s best friend. They take all of the guessings out of growth and tell you exactly how well your business is doing. And as you can see from the metrics above, there are all sorts of numbers that tell you helpful things about your business.
Then you can use all those numbers to paint a completely honest picture of your business.
And once you have that, you can start to make changes that you need to achieve growth. Then, you can see if you were able to do it by simply comparing your current numbers to your previous numbers.
It really is that simple, but it’s also really that powerful. You can impact your business’s success in real-time, all by taking the time to figure out what success actually looks like. And although that includes money in your bank account, metrics show you that success goes so much further than that.
Track metrics and take control of your business. Trust me, you won’t regret it.
The post The Metrics that Matter for Your Business (And Where to Find Them) appeared first on DigitalMarketer.
Source: digitalmarketer.com

Analytics Consulting
Most companies think their data is clean; that they’re making good decisions with the data they have. Most of these companies are wrong; they just don’t know it yet. This is why companies need analytics consulting. They don’t know what they don’t know.
Your analytics should tell you everything.
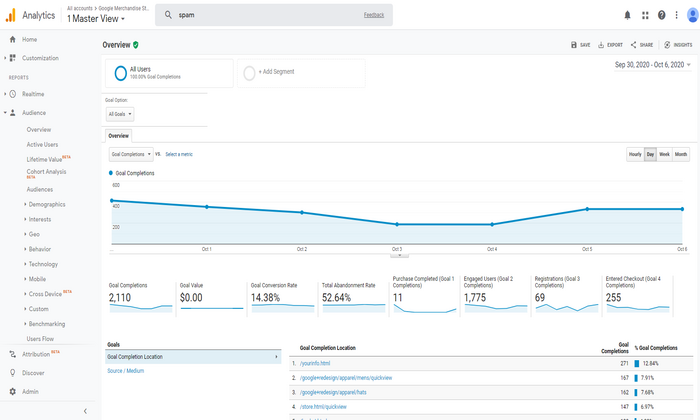
Tools like Google Analytics are incredibly valuable for businesses. Once you’re setup, you’ll have everything you need to analyze your performance data properly. Instead, many companies have realized that their analytics tools have introduced a lot of unexpected problems.
They’re not getting the kind of value they need.
That’s good news. Most companies think their data is clean; that they’re making good decisions with the data they have. Most of these companies are wrong; they just don’t know it yet. This is why companies need analytics consulting. They don’t know what they don’t know.
Today, I’ll show you how to find the right analytics consultant for your business.
4 Ways an Analytics Consultant Can Help Grow Your Business
Many companies make the wrong assumptions. Using a tool like Google Analytics, clients think all they have to do is drop the tracking code into their web pages, log into their account, and begin analyzing their data. It sounds easy, but it often isn’t.
There’s more to it than that.
This is why you need an analytics consultant. With the right consultant, you’ll have the education you need to grow your business. You’ll be able to pull insights out of your data using a variety of methods. Each of these strategies is important because they have a cumulative effect on your business.
Here are four ways analytics consulting can help you grow your business.
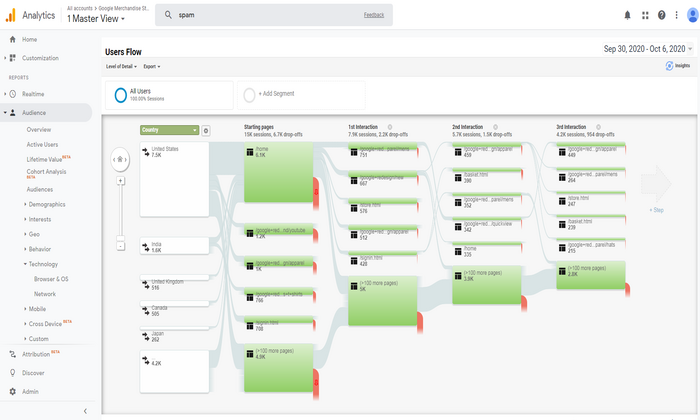
1. Exclude spam traffic via bots, scrapers, and spiders
How much of your traffic comes from real visitors? How much of it comes from bots, scrapers, and spiders? According to Imperva, almost half of all internet traffic is non-human. In 2014, Google introduced an obscure setting that enables you to filter out bots and spiders listed in IAB’s Interactional Spiders and Bots list.
This low-key setting is buried in Google Analytics, but it’s incredibly important; many small businesses still aren’t aware of this setting.
You’ll also need help to filter out referral spam.
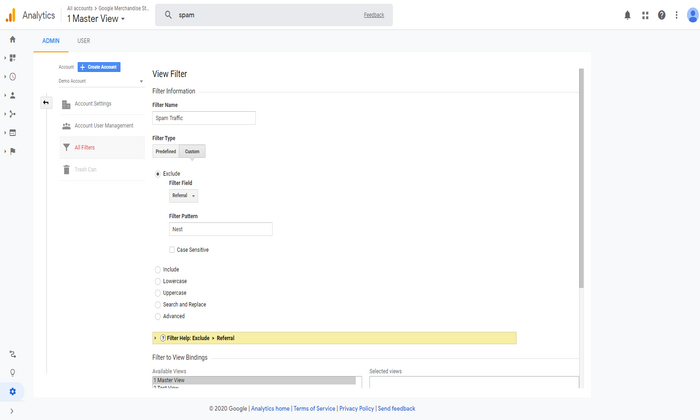
Referral spam is basically fake website hits; these bots, scrapers, and spiders land on your site. Site owners send their spam to your site. They hope you’ll see these referrals in your Google Analytics account, clickthrough, and visit their site.
This junk traffic poisons your data.
It gives you false readings based on inaccurate data. Your site may be more or less profitable, depending on your visits-to-spam ratio on your site. This isn’t something many businesses watch for in their analytics reports.
A good analytics consultant will consistently filter the variations of spam traffic (e.g., direct spam traffic, referral spam traffic, etc.) out of your reports, so you get a clear picture of your marketing performance.
2. Help you analyze your data properly
A lot of companies don’t know how to analyze their data properly. According to Forrester, between 60 and 73 percent of a company’s analytics data goes unused. Companies collect lots of data on customer activity, but they aren’t using it, why?
There are lots of reasons.
- Companies don’t know what they have Companies aren’t aware of the value of their data
- They don’t know how to evaluate or analyze their data
- Their data isn’t available to those who can use it There’s too much data to go through and not enough time to use it
Think about it.
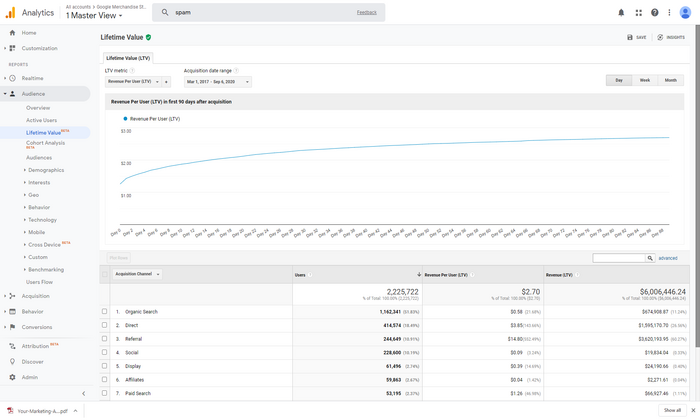
Right now, your company has valuable data about your customers. This is data you can use to attract more customers, lower expenses, grow faster, jump ahead of competitors, etc.
If you’re unaware of the data, you can’t use it.
A good analytics consultant will help you analyze your data properly, showing you what you have and how you can use it to grow your business.
3. Identify the list of problems you’re trying to fix
Your data isn’t as valuable without context.
If you know the problem you’re trying to solve, you have a pretty good idea of the answers you’re looking for in your data.
That’s the problem though.
A lot of companies treat their analytics tools as a technology issue. They focus their attention on the obvious issues like hardware or software. They rarely treat their analytics as a question and answer tool. That’s exactly what it is, though.
Target had the right idea when they started their analysis with a problem/question.
Remember the story?“If we wanted to figure out if a customer is pregnant, even if she didn’t want us to know, can you do that?” It’s a creepy story that shows the power of questions and problems. A great analytics consultant will help you discover the issues you’re trying to solve and the questions that need answers.
4. Focus your attention on the metrics that explain why
Analytics tells you what happened — what visitors did when they arrived on your site, the ads they responded to, what they read most often, etc. It doesn’t tell you why visitors do the things they do. Understanding what is important, but it’s more important to understand why something happens.
Focusing on the right metrics is the answer.
The right analytics consultant will help you answer the “what” — basically looking in the rearview mirror. But they’ll also help you look ahead; They’ll dig deeper, showing you the why behind visitor and customer behaviors.
Your analytics consultant should provide you with the education and support you need to squeeze more value out of your data.
How to Get Started With an Analytics Consultant
Avinash Kaushik has a three-step framework he uses to help analytics consultants support their clients. He calls it Data Capture. Data Reporting. Data Analysis. The nice part about this framework is the fact that it’s easy for both clients and consultants.
Consultants can use each of these buckets to analyze your goals, objectives, and the results they want to accomplish with each.
You’re basically goal setting with this framework.
Here’s a closer look at each of these three buckets and the goals for each of these.
Data Capture:
Work in this bucket is focused on audits or updating data capture methods (e.g., updating, editing, or customizing tags). This step is especially important because it determines the quality of what comes afterward. If you’ve done a good job with your data capture methods, you’ll have accurate data and reporting you can use for your analysis.
Data Reporting:
Your consultant sets up the reports you need on the intervals required. Your consultants help you identify the reports you’ll need, and they provide you with the reports you need regularly.
Data Analysis:
This is what Avinash calls an open-ended assignment, but it’s one you’ve provided to your consultant. You’re asking them to answer specific questions for you — your consultant should be able to show you what to measure, what your data is saying, what to do based on your data, and why you should do it.
Here’s what this means for you.
You’ll want to find an analytics consultant or agency that can handle all three steps in this framework. This also means you’ll need a clear idea of problems you’re dealing with ahead of time.
Measuring the ROI of Analytics Consulting Services
Many companies don’t understand analytics. If you don’t understand analytics, that’s okay; you just need to know whether you’re generating a return on your analytics investment. According to Nucleus Research, analytics returns $13.01 for every $1 invested.
Your consultant should be able to calculate your return on analytics investment.
This obviously much easier if your consultant is focused on the data analysis bucket. Suppose they’ve made several data-driven improvements to your site over three to six months. Their recommendations lead to an increase in revenue, profit, or a return on investment for you.
They should be able to verify your return on investment using the worksheet I’ve linked above.
The good news is the fact that analytics, as a discipline, is data-driven.
Checklist For Finding the Right Analytics Consultant
Choosing the right analytics consultant requires a very different set of skills. If you’re working with an independent analytics consultant, you’ll need to approach this in one of two ways.
Choose a consultant with all of the skills needed to perform across all three buckets (data capture, reporting, analysis). Choose an agency with analysts and implementation specialists needed to generate the results you need.
Here’s a list of the skills needed for each of the three roles in your buckets. Avinash breaks these skills down in detail in his web analytics consulting framework post.
Here’s a quick summary.
- For the data capture bucket, your consultant should have the skills of an implementation specialist. They’re experienced with tag managers; they understand data dimensioning and working knowledge of tracking variables.
- With the data reporting bucket, your consultant should be familiar with report creation in your analytics platform; they should also have a master list of the custom reports you’ll need for various options. It’s also ideal if your consultant has a working knowledge of his own set of customizations.
- For the data analysis bucket, your consultant should be a web analyst. Your consultant should be comfortable with advanced statistics and analytical techniques. They should be experienced in descriptive, diagnostic, predictive, and prescriptive analytics.
If you’re working with an independent consultant, they should be an industry veteran with the skills I’ve listed above. If you’re working with an agency, they should have employees with the skills for each bucket. If you have implementation specialists, you can handle data capture and possibly reporting.
Just make sure they’re a fit for that role.
Conclusion
Many companies aren’t familiar with analytics consulting. They’re not entirely sure how analytics impacts their organization. That’s okay, as long as the ROI is there.
Using a tool like Google Analytics, many companies assume that all they need to do is customize the tracking code, drop it onto their web pages, log into their account, and begin analyzing their data. It should be that easy, but it isn’t.
There’s more to it than that.
With most companies, their analytics data goes unused, they collect lots of data on customer activity, but they don’t know how to squeeze value out of their data. Analytics consulting can help you evaluate your performance data properly. Choose the right team, and your data will tell you what you need to know.
The post Analytics Consulting appeared first on Neil Patel.
Source: feedproxy.google.com

How to Choose The Right Analytics Agency
Before rushing into hiring an analytics agency, take the time to conduct a full audit of where you are today and where you want to be, while being conscious of how leveraging data can help you get there.
In our modern digitally enhanced world, data and information underpin all of our activities.
But are you making your data work for you, or is it something that you are yet to take full advantage of?
For many business owners and marketers, analyzing and deploying data can be an intimidating prospect.
For that reason, analytics agencies have emerged, whose aim is to help businesses leverage their data for better decision making and improved outcomes.
If you are thinking about hiring an analytics agency, here is everything you need to know.
Know Your Goals and Desired Outcomes
Like when working with any agency partner, you first need to consider your current situation and goals.
The reason for this is that not every analytics agency is built in the same way.
Some agencies work with certain industries or companies at different stages of maturity.
Other agencies specialize in certain areas of analytics such as marketing vs operations.
There are also differences in how they execute. For instance, one agency may rely heavily on technology to power its insights. Whereas others may rely more on their years of experience and human intuition.
Think about Your Goals
When thinking about your goals, consider these aspects:
- Your existing data – Think about the data assets that you are currently building. This can include things like marketing channels (search, PPC, content), operations, or product data.
- The role of data in your business – Next, you will need to think about the role that data plays in your business. For instance, do you need to use data to predict and manage your inventory? Or perhaps you may need to leverage data to scale an existing marketing channel.
- Your budget – Naturally, there is a varying service fee depending on which agency you work with. Depending on what you want to achieve, you need to think about how much budget you can allocate to an analytics service.
- Business priorities – Ultimately, you will need to think about what is a priority for your business at the moment. This is where you should spend most of your time thinking and see how data and analytics syncs up with your main priority. Maybe you need to optimize your processes to reduce costs. Or perhaps you need to discover new market segments by leveraging customer data.
Before rushing into hiring an analytics agency, take the time to conduct a full audit of where you are today and where you want to be, while being conscious of how leveraging data can help you get there.
6 Characteristics That Make a Great Analytics Agency
Choosing the right analytics agency can be tricky if you don’t know much about analytics yourself.
In addition to a partner that can provide all the technical fundamentals of analytics, you will need someone who guides you and helps you make sense of what’s going on with your data.
And in the ideal case, a partner can help take over the execution of your new data-informed strategy, particularly when it comes to the marketing aspect.
When evaluating an analytics agency, make sure that you vet for these characteristics.
Thought Leadership
Thought leadership describes the esteem and authority a company is held in in a particular industry.
This position is typically achieved by that company producing content that educates, solves industry problems and demonstrates superior expertise.
Take a look at the type of content that a given analytics agency is producing.
Are they even creating content at all?
Is the content insightful and communicated in a clear and concise manner (this also affects how they will communicate with you)?
An analytics agency that is producing good thought leadership content also signifies whether that company is on top of the latest trends, which is needed in fast-evolving fields.
Powerful Technology
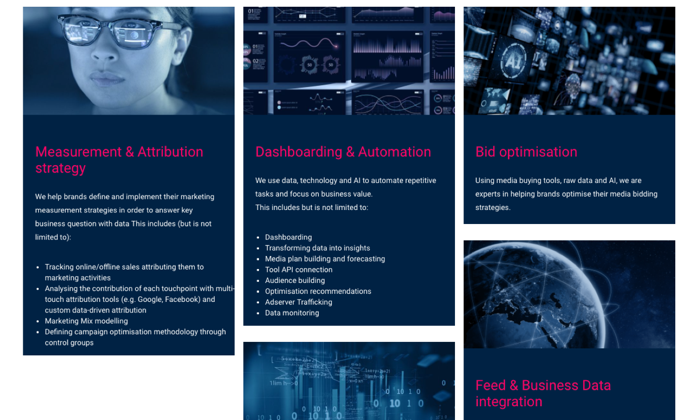
Your analytics agency partner will need to have the appropriate technologies built that can help you aggregate and make sense of your data.
Their technology will need to be able to integrate with your data sources such as Google Analytics or Shopify, depending on the platforms that you use.
They should also have a platform that allows you to view and make sense of this data in a way that provides an intuitive user experience – such as the ability to visualize data with graphs or easily download reports.
In an ideal case, your analytics agency will have more advanced technology such as machine learning algorithms which can crunch and manipulate data for deeper analysis.
A Well-rounded Team
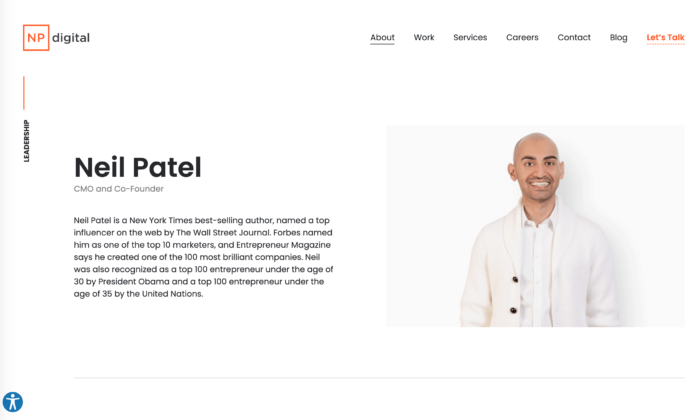
Analytics sits at the intersection between the world of numbers and the world of words.
There’s no point in collecting data if you can’t turn that data into actionable insights and strategy.
For that reason, the analytics agency that you work with will need to have a diverse set of team members who are both analytical but also creative.
This could include team members such as data scientists, psychologists, and digital marketers.
Bonus points for analytic agencies that have strong founders, as the insight and disposition of the founder is often imprinted onto the companies culture – affecting how they think and execute.
A Solid Client List

Sometimes, you can gauge the value of a company simply by looking at who they’ve worked with within the past.
If the analytics agency you are considering has an impressive track record of working with big names such as Google or Intuit, then chances are that they know their stuff.
One caveat though: even if the agency has worked with impressive brand names, it doesn’t mean that they will necessarily be the right fit for you.
For a start, you may not even be able to afford their fees. And even if you could, they may be more optimized to working with bigger clients or clients with different needs.
So consider also the relevance of their client list in relation to your particular situation.
Clear Communication
If you are working with an analytics agency, you want a partner that can explain to you the story behind your data.
The first way they need to do this is through their technology, which should allow you to visualize your data through graphs, charts, and other meaningful ways.
The second way they should do this is through how they communicate actionable insights through storytelling, and ideally strategy creation.
Remember that although data is objective, it doesn’t guarantee that the interpretation of that data will be objective too.
For that reason, your partner should always have a strong, clearly communicated, and logical case for their analysis. This way, you can know that you are making informed decisions.
Syncing With Your Team
Working with an analytics agency requires synchronization between both your technology and your teams.
Your development team will need to be able to easily integrate and set up with your partners.
Your marketing team will need to feel confident and informed enough to adapt their strategies based on the insights your partners are providing.
To work successfully with an analytics agency, both your teams need to be on the same wavelength. Strategy, expectations, and skillsets need to be well aligned to get the best results.
How to Work With an Analytics Agency
Each analytics agency that you work with will have a slightly different process. In general, however, there is an overriding structure that will be the same from company to company.
In order to reach a successful outcome when working with an analytics agency, you should typically go through these steps.
Share your goals –
Your agency partner should have a complete understanding of your goals including services, timeline, and results.
You will need to be as transparent as possible at the start of your relationship to ensure that you both have the appropriate expectations going forward.
For instance, if you will actually need help with the marketing execution but you’ve partnered with a tech-focused agency, there will likely be an issue later on.
Manage expectations –
It’s important to also manage clear expectations about what’s possible early on. Some agencies offer a variety of additional services such as helping with strategy or machine-generated analytics.
Others may just offer a simple dashboard. It’s also important to understand the role of analytics in general and what its uses and limitations are.
Map out your assets –
Your data assets represent the existing ways that you are collecting and storing data across your business.
You will need to map out all your existing assets such as marketing channels (Google Analytics, etc), operations (inventory management, etc), and technology.
These will then be used by your analytics agency for integration and analysis.
Integration –
With your assets in place, you will then need to integrate them with your analytics partner.
In the best case, your partner will have their own platform and will work with your development team to connect your data assets.
If you are working with a smaller agency, however, they may choose to access your data directly, in which case you would need to provide them the login credentials to the software you use.
Reporting –
Once everything has been connected, your analytics agency will begin conducting an audit of your existing data assets.
If they have a platform, you will be able to access and view all of your data in one place.
The best agencies will allow you to view and manipulate your data in a user-friendly way through graphs, charts, and reports.
They may also have machine learning technology that makes sense of your data without any human input.
Analysis –
With technology, the human eye, or a combination of both, your analytics agency will help you make sense of your data by telling you the story behind the numbers.
They should then help you produce actionable insights which will inform your strategy going forward.
Strategy –
With your existing data fully analyzed, you will then need to update your strategy, depending on the insights produced.
For instance, you may choose to double down on a particular sales channel or realize that you need to remove a bottleneck in your operations.
Execution –
Some analytics agencies offer services beyond analytics, such as marketing execution.
Your data may signify that you lack the necessary human capital to generate results with your existing or new strategy.
Here, your agency partner may be able to help by taking over the reins of wherever you are coming up short.
Monitoring –
On an ongoing basis, your agency partner will work with you to ensure that your data, strategy, and execution are all synced up.
You should be having analysis and strategy meetings with them at least once a month, but also be able to access your data and any computer-generated insights on demand.
How to Find The Right Analytics Agency For You
Finding the right analytics agency requires that you look out for and vet certain things. We have spoken about some characteristics to look out for here and what to expect when working with an analytics partner.
Here is a quick summary of the things to look for when finding the best analytics agency:
Characteristics:
Full-stack marketers –
When analyzing your marketing data, it helps a lot if your analytics agency is marketers themselves.
That way, they can help turn your data into strategies that actually get results.
Strong technology –
An analytics platform is a bare minimum your agency partner should have.
If they have machine learning and data-crunching algorithms, even better.
An all-star team –
Your analytics agency needs to have a diverse set of team members that understand both numbers and marketing psychology. A strong founding team is also something to look out for.
A strong client roster –
Agencies that have worked with big brands are always a good sign. But when inquiring, try to find out if they have worked with brands similar to yours in terms of size and industry.
A great communication style –
Making sense of data is one thing, but explaining it in a clear and concise manner is something else. An analytics agency that can storytelling in a meaningful way will help you put your data to use.
They take a holistic approach –
There are numerous sources of data that you are probably collecting. The more sources of data they can integrate and analyze the better.
What to expect:
Onboarding and integration –
The first thing your agency partner should do is onboard you to their platform and talk you through the process.
This will include things like syncing up your technology and managing expectations in terms of outcomes.
Auditing of assets –
Next, they will need to do an audit of your existing data assets and come up with actionable insights which will turn into strategy and then execution.
Setting up marketing channels –
If your analytics agency offers services beyond analytics, they will work with you to execute your marketing strategy, including channels such as SEO, PPC, and social media.
Data management –
On a continuous basis, you will be able to access and view your data through your agency partner. You will be able to download reports and visualize your data.
Actionable insights and results –
The best analytics agencies really stand out when it comes to translating your data into insights, strategy, and execution.
You should work with your agency to ensure that your data is informing decision-making and driving results.
The Top 3 Analytic Agencies
There are hundreds of good analytic companies out there that serve all types of needs.
It is unlikely however that you have the time to go through and vet them all, so we’ve filtered down the top 3 analytic agencies, based on the various criteria we’ve discussed in this article.
The top 3 agencies listed here have different strengths and weaknesses, so you will have to decide which is the best fit for you.
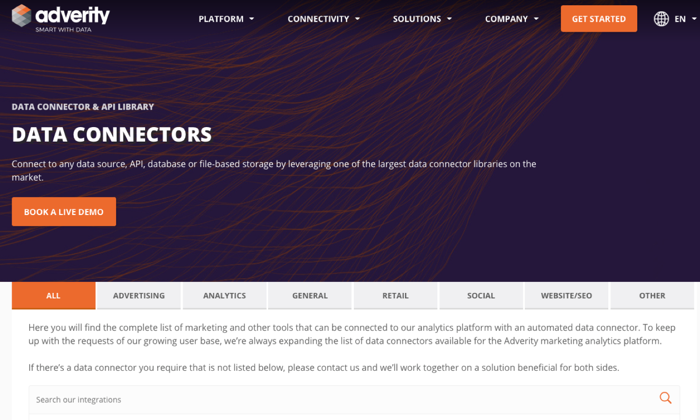
1 – NP Digital — Best For Marketing Execution
If you think that you will need helping to put the insights from your data into practice, then you should work with NP Digital.
The agency was founded by Neil Patel, one of the most influential digital marketers in the world.
And in addition to the analytics services they provide, they can also help you set up and execute a results-driven marketing strategy.
They have worked with big brand names including companies such as Google and Intuit.
2 – Artefact — Best For Technology

Perhaps you are in an industry where you have a ton of data to analyze, or data plays a critical role in your ability to compete in the market.
In this case, you should consider Artefact, an agency that has a robust technology stack that leverages artificial intelligence to really get the most out of your data.
They have a strong and diverse team, ranging from social scientists to statisticians, and have worked with companies such as Greenpeace and Carrefour.
3 – Adverity — Best For Smaller Businesses
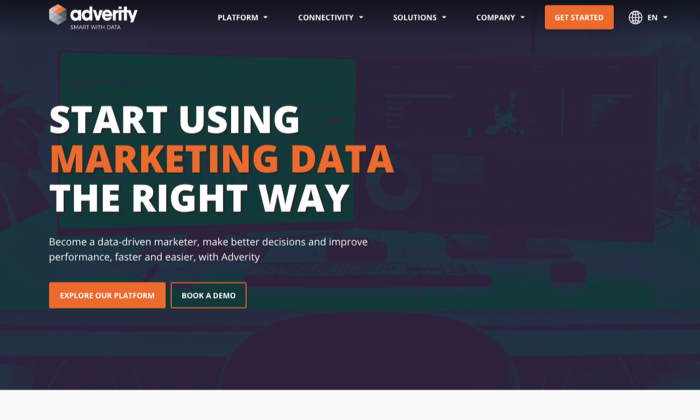
For smaller businesses that may not be able to afford high-end agency fees, Adverity may be a better match.
Although Adverity is more of a technology platform than an agency partner, you will be able to amplify your analytics strategy at a fraction of the cost.
The platform allows you to integrate data sources from operations to marketing.
The drawback of course is that you don’t have the human level insight and execution that consultative agencies provide.
Adverity currently has a 4.5/5 star rating with over 100 reviews on the G2 website.
Conclusion
At this point, you should have a good idea of how to choose an analytics agency.
Keep in mind that everything is written is from our perspective, and there may be other things you should consider when evaluating an agency.
Before you finally pull the trigger and sign any contract, make sure that the analytics agency you want to work with has worked with companies similar to yours and that they can demonstrate some results.
The post How to Choose The Right Analytics Agency appeared first on Neil Patel.
Source: neilpatel.com

Building a Solid Foundation for Advanced Analytics Maturity
As the best of big data analytics and business intelligence coalesce, organizations now have their sights set on AI for predictive and prescriptive analytics. But how can they get there?

Effective predictive and prescriptive analytics
Effective predictive and prescriptive analytics will put an organization at an advanced analytics maturity level, but a solid foundation at the more basic levels has to come first.
Earlier analytics maturity phases, including descriptive and diagnostic/root cause analytics, and intermediate levels, such as operational analytics, must be addressed robustly before further phases can be approached successfully.

Understanding the capacity your organization has to leverage analytics and designing your analytics to match that, maybe the best way forward, and this requires introspection and planning.
Join us for this free 1-hour webinar from GigaOm Research to discuss how to assess, shore up, and advance your company’s analytics maturity.
The webinar features GigaOm analyst Andrew Brust and special guest Steve Mahoney, Product Director from Looker, a leading provider of modern analytics platform software.
In this webinar, you will learn:
- What a rational analytics maturity model looks like and where your organization lies within it
- How to strengthen the integrity of your current analytics maturity level
- How to map out your path to advanced analytics maturity and approach practical adoption of AI and machine learning
Register now to join GigaOm Research and Looker for this free expert webinar.

Who Should Attend:
- CIOs
- CTOs
- Chief Data Officers
- Business Intelligence Architects
- Business Analysts
- Data Scientists
Source: gigaom.com